Full Report
The numbers behind Charter Communications, Inc.: as-reported financial statements and company metrics for FY2021–FY2025, traced to the source filings, opened with the share-price history those statements have to justify. Every linked figure opens the exact page of the filing it was printed on, with the statement row highlighted. Amounts in US$ millions unless noted.
Reading notes: Statement figures for FY2021–FY2025 are taken from each fiscal year's own Form 10-K (Consolidated Statements of Operations, Balance Sheets, and Cash Flows) and verified to the page; net income shown is 'Net income attributable to Charter shareholders'. Revenue by product line is presented on Charter's current (FY2025 Form 10-K, Note 14) reporting basis for FY2023–FY2025, the three years printed together on that page. Charter reclassified its product-line presentation over time (mobile service was moved into Residential/Connectivity from 2023, a 'Connectivity' subtotal and the 'Small business'/'Mid-market large business' labels were introduced in the FY2025 10-K, and video revenue was restated modestly for a 'seamless entertainment allocation'); a consistent product-line series is therefore not available for FY2021–FY2022, which are left blank in this table. Long-Term Record: FY2019–FY2025 are page-verified (FY2019–FY2020 as comparative columns of the FY2021 Form 10-K); FY2016–FY2018 are from the standardized SEC XBRL data feed and are shown without page links. Quarterly cash-flow figures are derived from Charter's printed year-to-date cash-flow statements (each interim quarter = current YTD total minus the prior YTD total); the citation links open the verbatim printed YTD row. Derived quarters reconcile exactly to data/financials/cash_flow_quarterly.json where that feed carries the quarter.
Share Price — Full Available History — 17 Years
The stock closed at $129.22 on Jul 22, 2026 — up 269% over the window shown (+8.2% a year), trading between $29.50 and $821.01. At that close the stock trades at 3.6× FY2025 diluted EPS as reported below.
Source: market price feed, monthly closes, sampled from 4,162 source observations, Jan 2010–Jul 2026. Price return only, excludes dividends.
Market capitalization $30.3bn and enterprise value $124.6bn.
Market cap = 234.8M shares outstanding × the Jul 22, 2026 close of $129.22. Enterprise value adds total debt of $94.8bn and subtracts cash and equivalents of $477mn (net debt of $94.3bn), from the FY2025 balance sheet. Market-derived figures, shown without filing links.
FY2025 at a Glance
Revenue (US$ millions)
Net income (US$ millions)
Diluted EPS
Source: FY2025 consolidated statements [1] [2] [3] [4]. Click any linked figure to open the filing page with the row highlighted.
Revenue by Product Line
| Revenue by Product Line | FY2021 | FY2022 | FY2023 | FY2024 | FY2025 |
|---|---|---|---|---|---|
| Internet | — | — | 23,032 | 23,360 | 23,765 |
| Mobile service | — | — | 2,243 | 3,083 | 3,762 |
| Connectivity | — | — | 25,275 | 26,443 | 27,527 |
| Video | — | — | 16,353 | 15,129 | 13,703 |
| Voice | — | — | 1,510 | 1,437 | 1,350 |
| Residential revenue | — | — | 43,138 | 43,009 | 42,580 |
| Small business | — | — | 4,355 | 4,376 | 4,346 |
| Mid-market and large business | — | — | 2,767 | 2,878 | 2,969 |
| Commercial revenue | — | — | 7,122 | 7,254 | 7,315 |
| Advertising sales | — | — | 1,551 | 1,780 | 1,468 |
| Other | — | — | 2,796 | 3,042 | 3,411 |
| Total revenues | — | — | 54,607 | 55,085 | 54,774 |
| Total revenues growth, derived | — | — | — | +0.9% | -0.6% |
Source: Form 10-K Note 14, Revenues (revenues by product line); current reporting basis [5]. Click any linked figure to open the filing page with the row highlighted.
Income Statement
Source: Consolidated Statements of Operations [1] [2] [3] [4]. Click any linked figure to open the filing page with the row highlighted.
Columns marked E are consensus analyst estimates from S&P Capital IQ (CapIQ), shown alongside reported results for direct comparison; they are not company guidance.
Estimate source: S&P Capital IQ (CapIQ) consensus, as of 2026-07-23. Estimate figures are S&P Capital IQ consensus (vendor data — no filing page links). EPS and net income use the normalized (adjusted) consensus where the street reports it. Line-item analyst models (segments, drivers, KPIs) are in the Visible Alpha tab.
Balance Sheet
Source: Consolidated Balance Sheets [6] [7] [8] [9]. Click any linked figure to open the filing page with the row highlighted.
Cash Flow
Source: Consolidated Statements of Cash Flows [10] [11] [12] [13]. Click any linked figure to open the filing page with the row highlighted.
Customers ARPU
| Customers ARPU | FY2021 | FY2022 | FY2023 | FY2024 | FY2025 |
|---|---|---|---|---|---|
| Total voice customers | 9,903,000 | 8,983,000 | 8,005,000 | 6,884,000 | 6,046,000 |
| Monthly residential revenue per residential customer | 113.61 | 114.66 | 119.89 | 121.04 | 119.05 |
| Monthly revenue per small business (SMB) customer | 165.50 | 164.50 | 163.64 | 164.08 | 161.50 |
Source: company filings [14] [15] [16] [17]. Click any linked figure to open the filing page with the row highlighted.
Profitability Free Cash Flow (non-GAAP, as reported)
| Profitability Free Cash Flow (non-GAAP, as reported) | FY2021 | FY2022 | FY2023 | FY2024 | FY2025 |
|---|---|---|---|---|---|
| Adjusted EBITDA | 20,630 | 21,616 | 21,894 | 22,569 | 22,708 |
| Free cash flow | 8,684 | 6,102 | 3,490 | 4,257 | 5,004 |
| Leverage ratio (net debt / LTM Adjusted EBITDA) | 4.4 | 4.5 | 4.4 | 4.1 | 4.2 |
Source: company filings [18] [19] [20] [21]. Click any linked figure to open the filing page with the row highlighted.
Capital Expenditures by Category (as reported)
| Capital Expenditures by Category (as reported) | FY2021 | FY2022 | FY2023 | FY2024 | FY2025 |
|---|---|---|---|---|---|
| Customer premise equipment | 1,967 | 2,209 | 2,286 | 2,172 | 2,260 |
| Scalable infrastructure | 1,677 | 1,791 | 1,368 | 1,422 | 1,536 |
| Upgrade/rebuild | 706 | 845 | 1,719 | 1,771 | 1,937 |
| Support capital | 1,643 | 1,541 | 1,727 | 1,688 | 1,986 |
| Line extensions (total) | 1,642 | 2,990 | 4,015 | 4,216 | 3,940 |
| Subsidized rural construction line extensions | — | — | 1,822 | 2,144 | 2,202 |
Source: company filings [22] [23] [24] [25]. Click any linked figure to open the filing page with the row highlighted.
Long-Term Record
| Fiscal year | Total revenue | Income from operations | Net income attributable to Charter shareholders | Diluted EPS | Net cash flows from operating activities | Purchases of property, plant and equipment |
|---|---|---|---|---|---|---|
| FY2016 | 29,003 | 2,456 | 3,522 | 15.94 | 8,041 | (5,325) |
| FY2017 | 41,581 | 4,106 | 9,895 | 34.09 | 11,954 | (8,681) |
| FY2018 | 43,634 | 5,221 | 1,230 | 5.22 | 11,767 | (9,125) |
| FY2019 | 45,764 | 6,511 | 1,668 | 7.45 | 11,748 | (7,195) |
| FY2020 | 48,097 | 8,405 | 3,222 | 15.40 | 14,562 | (7,415) |
| FY2021 | 51,682 | 10,526 | 4,654 | 24.47 | 16,239 | (7,635) |
| FY2022 | 54,022 | 11,962 | 5,055 | 30.74 | 14,925 | (9,376) |
| FY2023 | 54,607 | 12,559 | 4,557 | 29.99 | 14,433 | (11,115) |
| FY2024 | 55,085 | 13,118 | 5,083 | 34.97 | 14,430 | (11,269) |
| FY2025 | 54,774 | 12,908 | 4,987 | 36.21 | 16,077 | (11,659) |
Source: consolidated statements across filings; older years from the standardized feed [10] [1] [11] [2]. Click any linked figure to open the filing page with the row highlighted.
Operating KPIs
| KPI | FY2021 | FY2022 | FY2023 | FY2024 | FY2025 |
|---|---|---|---|---|---|
| Total customer relationships | 32,069,000 | 32,195,000 | 32,126,000 | 32,214,000 | 31,846,000 |
| Total Internet customers | 30,089,000 | 30,433,000 | 30,588,000 | 30,083,000 | 29,680,000 |
| Total mobile lines | 3,564,000 | 5,292,000 | 7,766,000 | 9,858,000 | 11,766,000 |
| Total video customers | 15,833,000 | 15,147,000 | 14,122,000 | 12,892,000 | 12,605,000 |
Source: company-reported operating metrics [14] [16] [17] [26]. Click any linked figure to open the filing page with the row highlighted.
Analyst Consensus
Mean target
Median target
High target
Low target
Street ratings: 5 strong buy, 11 hold, 2 sell, 3 strong sell. Consensus: Hold.
Estimate source: S&P Capital IQ (CapIQ) consensus, as of 2026-07-23. Estimate figures are S&P Capital IQ consensus (vendor data — no filing page links). EPS and net income use the normalized (adjusted) consensus where the street reports it. Line-item analyst models (segments, drivers, KPIs) are in the Visible Alpha tab.
Traceability
351 of 369 figures on this page (95%) link to the filing page where they are printed — click a linked figure to open the source PDF at that page with the row highlighted. Unlinked figures come from standardized data feeds or pre-filing years.
Statement figures for FY2021–FY2025 are taken from each fiscal year's own Form 10-K (Consolidated Statements of Operations, Balance Sheets, and Cash Flows) and verified to the page; net income shown is 'Net income attributable to Charter shareholders'.
Revenue by product line is presented on Charter's current (FY2025 Form 10-K, Note 14) reporting basis for FY2023–FY2025, the three years printed together on that page. Charter reclassified its product-line presentation over time (mobile service was moved into Residential/Connectivity from 2023, a 'Connectivity' subtotal and the 'Small business'/'Mid-market large business' labels were introduced in the FY2025 10-K, and video revenue was restated modestly for a 'seamless entertainment allocation'); a consistent product-line series is therefore not available for FY2021–FY2022, which are left blank in this table.
Long-Term Record: FY2019–FY2025 are page-verified (FY2019–FY2020 as comparative columns of the FY2021 Form 10-K); FY2016–FY2018 are from the standardized SEC XBRL data feed and are shown without page links.
Quarterly cash-flow figures are derived from Charter's printed year-to-date cash-flow statements (each interim quarter = current YTD total minus the prior YTD total); the citation links open the verbatim printed YTD row. Derived quarters reconcile exactly to data/financials/cash_flow_quarterly.json where that feed carries the quarter.
Charter pays no common dividend; capital returned to shareholders is via share repurchases ('Purchase of treasury stock').
Charter Communications, Inc.'s management answers for the business every quarter. These are the exchanges that explain it best — verbatim, from the call transcripts preserved in Sources. Each link opens the full transcript at that page in a new tab.
Q1 FY2026 Earnings Call — Q1 FY2026
The post-Cox operating playbook laid bare: how the acquired base's economics convert, why Charter keeps its pricing model, and where broadband growth actually breaks. · Open the full transcript →
The actual full-year frame: EBITDA to grow 'slightly' ex-transition costs, with offer tuning the swing factor.
Jessica Fischer (CFO); Sebastiano Petti (JPMorgan): We do continue to plan to grow EBITDA slightly this year […] how close to the line we are on EBITDA growth.
p. 10 · Read in context →
Q2 FY2025 Earnings Call — Q2 FY2025
The first earnings call after the Cox deal: management's fullest explanation of the acquisition's rationale, financing, and integration playbook — and a candid read on why broadband still shrinks. · Open the full transcript →
How the deal sits on the balance sheet: sub-4.25x through close, a 3.5–4.0x long-term target, delever to the middle within two to three years.
Jessica Fischer (CFO): As of the end of the second quarter, our ratio of net debt […] within two to three years following close.
p. 5 · Read in context →
The new T-Mobile business MVNO alongside Verizon — why Charter wants multiple carrier relationships to attack the business segment.
Chris Winfrey (President & CEO); Craig Moffett (MoffettNathanson): Just entered into, I think, a very strategic relationship with T-Mobile […] the ability to combine those mobile products together with already our market and priceleading wireline services […] And so this opens the door for us to go do that.
p. 6 · Read in context →
Asked why broadband keeps shrinking, Winfrey's candid diagnosis: stable-not-improving competition, low moves, a mobile-only mix-shift, a new lower-quality rival.
Chris Winfrey (President & CEO); Peter Supino (Wolfe Research): The competitive landscape remains stable, not improving or declining […] it creates pressure, which is not ideal.
p. 9 · Read in context →
Q3 FY2024 Earnings Call — Q3 FY2024
Where the 'Life Unlimited' pricing model was laid out and the ACP subscriber shock was sized — the reset in how Charter packages and prices connectivity. · Open the full transcript →
The Life Unlimited economics: a lower $40 gig headline with multi-year price locks that still lifts customer ARPU.
Chris Winfrey (President & CEO): Our new pricing and packaging will drive more sales with higher selling of our best products […] Xumo, and Cloud DVR at no additional charge.
p. 2 · Read in context →
Sizes the ACP hit — ~200k Q3 losses, a ~100k Q4 tail — and shows the retention thesis held: most former ACP customers stayed.
Jessica Fischer (CFO): The end of the ACP program drove higher third quarter non-pay and voluntary churn […] we've retained the vast majority of our customers who were previously receiving an ACP benefit. […] fourth quarter customer results will include impacts from the storms […] we expect the one time impacts from ACP to be behind us.
p. 3 · Read in context →
More calls
Q4 FY2025 Earnings Call — Q4 FY2025 · 10 pages · The full-year 2025 wrap and updated guidance framework, plus the latest read on Cox deal progress and 2026 setup. · Open →
Q3 FY2025 Earnings Call — Q3 FY2025 · 13 pages · Cox regulatory progress and BEAD updates, with more detail on how the combined footprint's build economics are expected to work. · Open →
Q1 FY2025 Earnings Call — Q1 FY2025 · 10 pages · The first full quarter under Life Unlimited pricing, just before the Cox announcement — a clean read on whether the packaging reset moved subscribers and ARPU. · Open →
Q4 FY2024 Earnings Call — Q4 FY2024 · 12 pages · The full-year 2024 wrap and the Liberty Broadband transaction detail — the reader gets the pre-Cox capital-structure and share-count picture. · Open →
Q2 FY2024 Earnings Call — Q2 FY2024 · 12 pages · The quarter the ACP wind-down actually hit the numbers — go here to see how the realized subscriber and ARPU impact compared with the Q1 framing. · Open →
Q2 FY2023 Earnings Call — Q2 FY2023 · 14 pages · An earlier baseline on the convergence and Spectrum One strategy, before ACP and heavy fixed-wireless competition dominated the narrative. · Open →
Charter Communications, Inc.'s annual reports contain management's most considered account of the business. These are the sections, passages and visual pages worth opening in the originals preserved in Sources.
Charter Communications — FY2025 Annual Report (Form 10-K) — FY2025
The latest 10-K: converged broadband/mobile strategy, the Cox and Liberty Broadband deals, and a 4.15x-levered balance sheet. · Open the full document →
Item 1. Business — p. 7 · Read the full section →
How Charter defines itself — a fiber-powered broadband company monetizing more products per customer to lower churn and cost.
The strategy: sell more products per relationship to cut churn, acquisition and service cost.
We are a leading broadband connectivity company with services available to 58 million homes and small to large businesses across 41 states through our Spectrum brand. Founded in 1993, we have evolved from providing cable TV to streaming, and from high-speed Internet to a converged broadband, WiFi and mobile experience. […] Our strategy is focused on utilizing our fiber-powered network to deliver high-quality, competitively priced products, with outstanding service, allowing us to increase both the number of customers we serve over our network and the number of products we sell to each customer. This combination also reduces the number of service transactions we perform per relationship, yielding higher customer satisfaction and lower customer churn, which results in lower costs to acquire and serve customers and drives greater profitability.
p. 7 · Read in context →
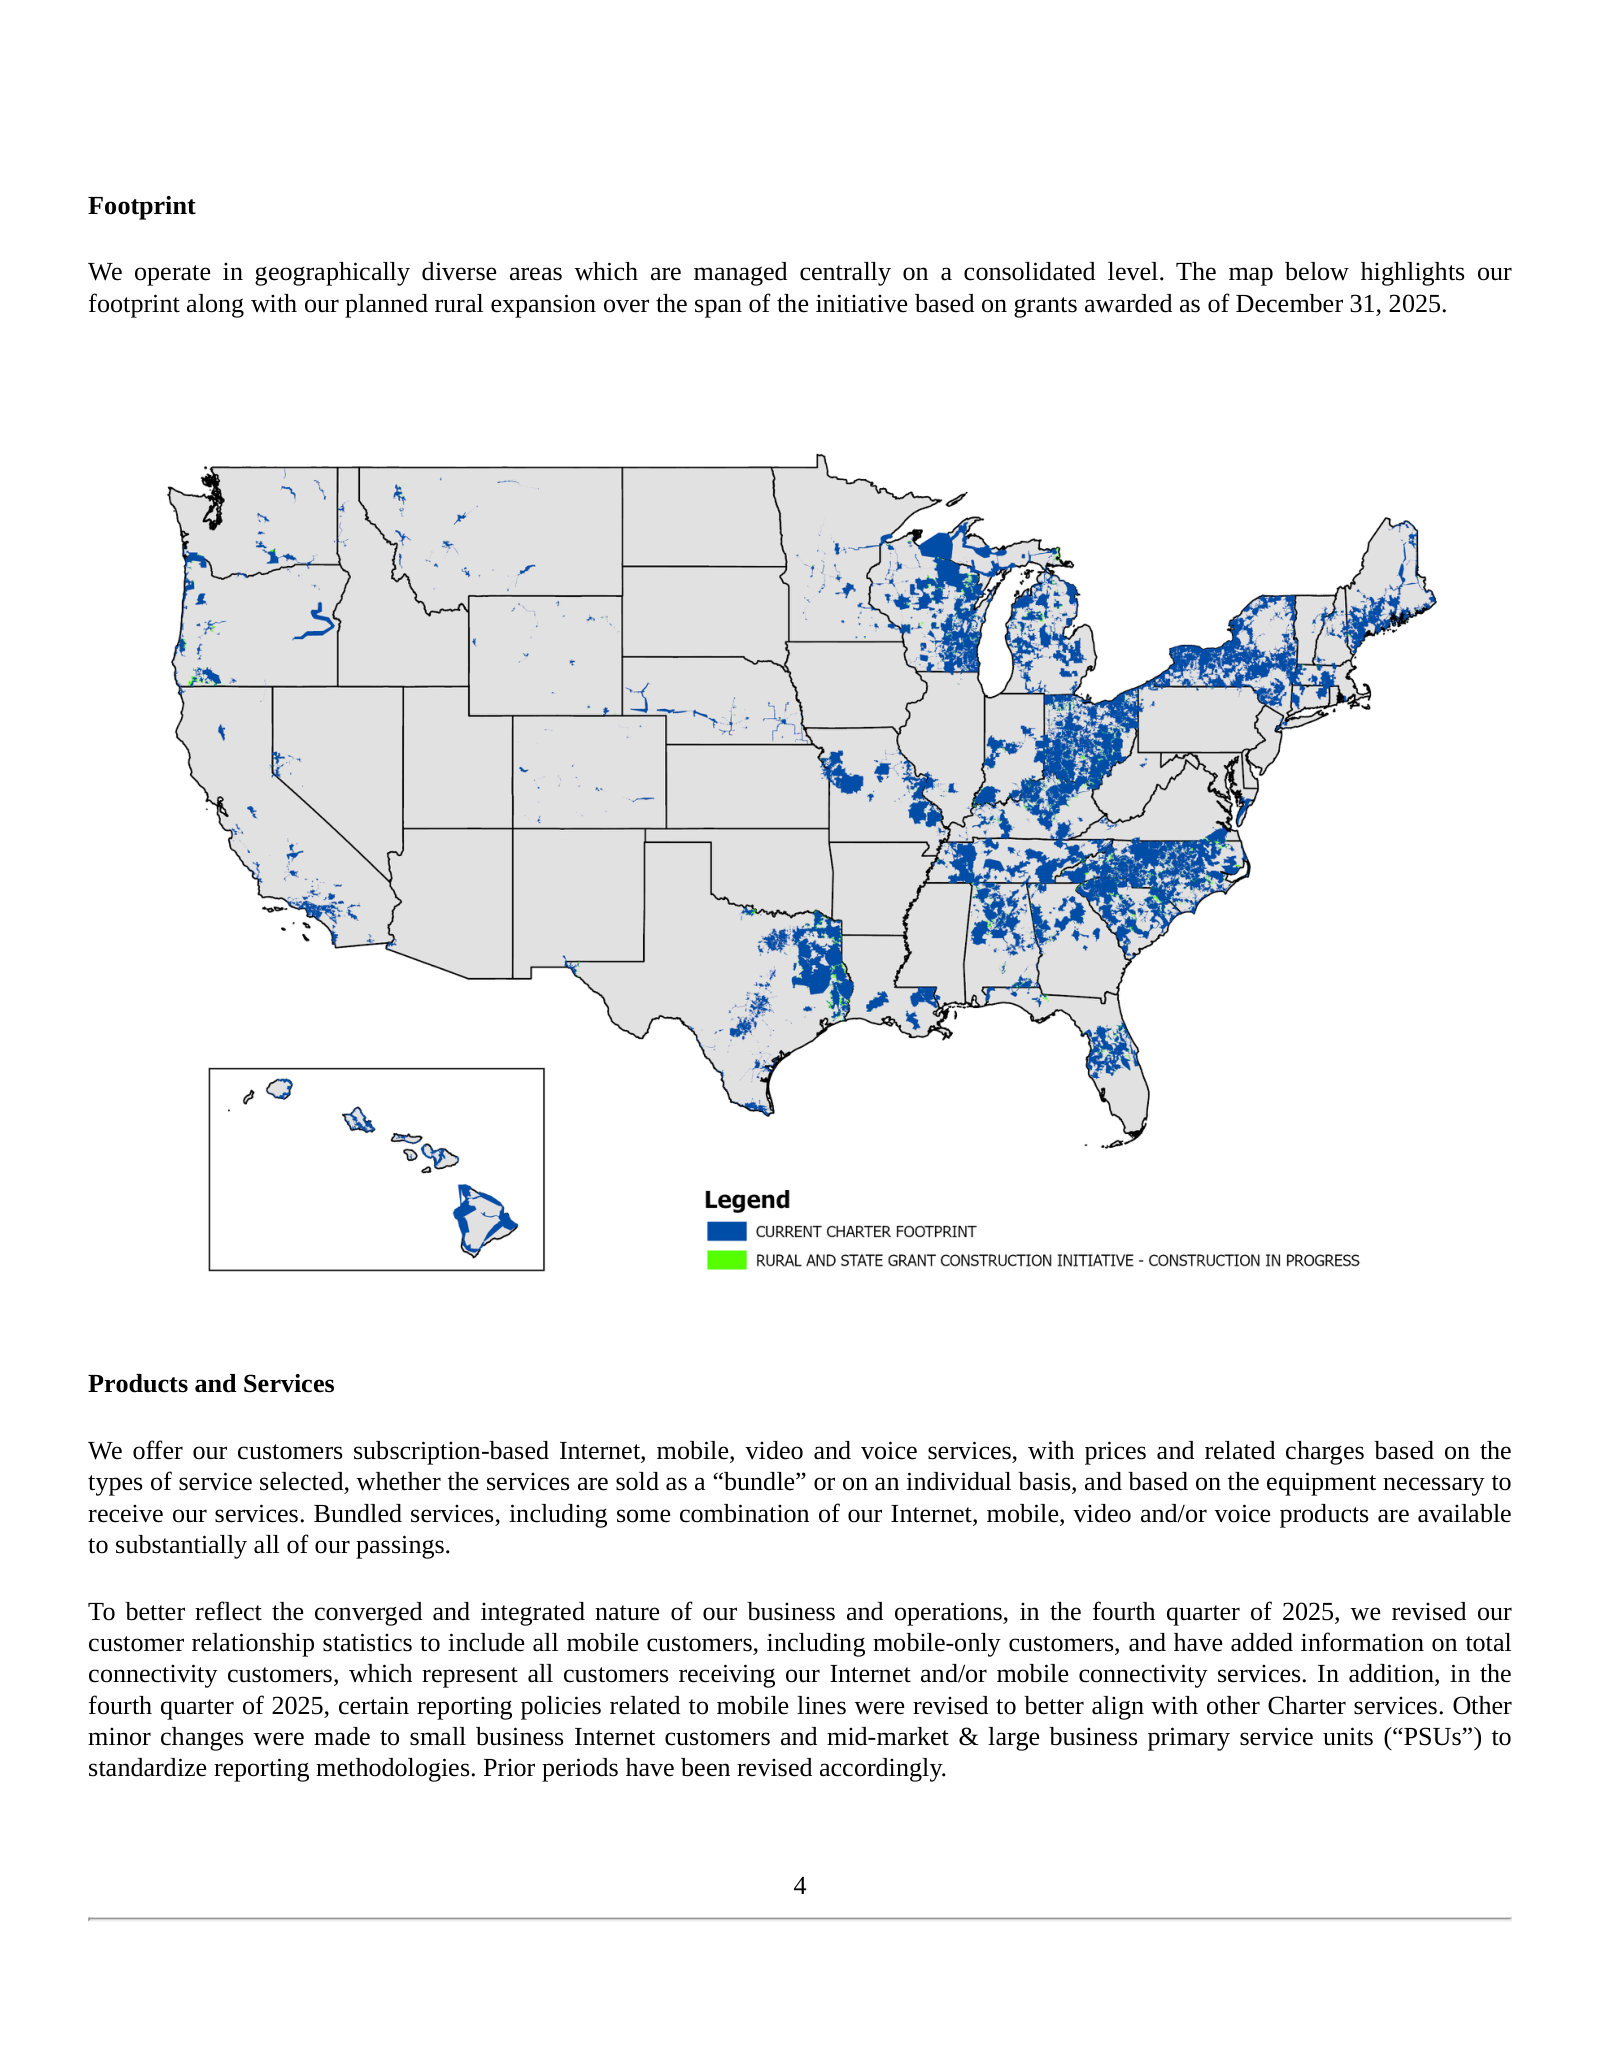
Item 1. Business — Competition — p. 27 · Read the full section →
The core bear case in management's own words: fiber overbuilders (AT&T, Verizon) and fixed-wireless attacking the broadband base.
Residential Internet competition from FTTH, fixed wireless, satellite and DSL across the footprint.
Our residential Internet service faces competition across our footprint from fiber-to-the-home ("FTTH"), fixed wireless broadband, Internet delivered via satellite and DSL services.
Several FTTH competitors deliver 1 Gbps broadband speed (and some deliver multi Gbps) in at least a portion of their footprints which overlap our footprint. AT&T Inc. ("AT&T") and Verizon are our primary FTTH competitors. We face terrestrial broadband Internet (defined by the Federal Communications Commission (“FCC”) as at least 100 Mbps) competition from AT&T and Verizon in approximately 27% and 16% of our operating footprint, respectively. DSL service is also offered across our footprint often at prices lower than our Internet services, although typically at speeds much lower than the minimum speeds we offer as part of our Spectrum pricing and packaging. In addition, commercial areas, such as retail malls, restaurants and airports, offer WiFi Internet service. Numerous local governments are also considering or actively pursuing publicly subsidized WiFi Internet access networks. In addition, providers are constructing open access networks that can deliver services from multiple underlying Internet service providers. These options offer alternatives to cable-based Internet access.
p. 27 · Read in context →
Item 1A. Risk Factors — p. 44 · Read the full section →
The two risks that could actually bite: intensifying broadband/mobile competition and a ~$95B debt load with more deal debt coming.
Competitive risk: FTTH, 5G/fixed-wireless and streaming pressuring Internet, mobile and video.
The industry in which we operate is highly competitive and has become more so in recent years. In some instances, we compete against companies with fewer regulatory burdens, better access to financing and greater and more favorable brand name recognition. Increasing consolidation in the telecommunications and content industries have provided additional benefits to certain of our competitors, either through access to financing, resources, or efficiencies of scale including the ability to launch new products and services.
Our Internet service faces competition from other companies’ FTTH, cell phone home Internet service, Internet delivered via satellite and DSL services. Various operators offer wireless Internet services delivered over networks which they continue to enhance to deliver faster speeds and also continue to expand 5G mobile services as they seek to offer converged connectivity services similar to ours. Our mobile and voice services compete with wireless and wireline phone providers, as well as other forms of communication, such as text, instant messaging, social networking services, video conferencing and email. Competition from these companies, including intensive marketing efforts with aggressive pricing, may have an adverse impact on our ability to attract and retain customers.
p. 44 · Read in context →
Leverage risk: ~$94.6B principal, 4.15x Adjusted EBITDA, plus new debt for the Cox and Liberty deals.
We have a significant amount of debt, with total principal amount of approximately $94.6 billion and a leverage ratio of 4.15 times Adjusted EBITDA as of December 31, 2025. We expect to (subject to applicable restrictions in our debt instruments) incur additional debt in the future as Charter plans to maintain leverage near the midpoint of its stated 4.0 to 4.5 times Adjusted EBITDA target leverage range (net debt divided by the last twelve months Adjusted EBITDA) in the period leading up to the Closing. As part of the Cox Transactions, Charter will fund the $4.0 billion of cash consideration using debt and will assume Cox Communications' approximately $12.6 billion of net debt and finance leases. Charter plans to adjust its long-term target leverage range after Closing to 3.5 to 3.75 times Adjusted EBITDA but will still have a significant amount of debt.
p. 52 · Read in context →
Item 7. MD&A — Overview & Results of Operations — p. 80 · Read the full section →
Management's account of what drove FY2025: 1.9M mobile lines added, Internet/video losses easing, sales pressured but churn lower.
FY2025 drivers: mobile line growth, improving connectivity losses, Life Unlimited pricing and programmer deals.
During the year ended December 31, 2025, we added 1.9 million mobile lines while Internet and video losses improved as compared to the prior year period. Sales were challenged by the competitive environment but were offset by lower customer churn. We remain focused on improving customer results through our brand platform, Life Unlimited which emphasizes the power of our advanced fiberpowered network and cutting-edge connectivity products and services, and our simplified pricing and packaging strategy that better utilizes our seamless connectivity and entertainment products to offer lower promotional and persistent bundled pricing to drive growth. Our Internet and mobile product bundles provide a differentiated connectivity experience by bringing together Spectrum Internet, Advanced WiFi and Unlimited Spectrum Mobile to offer consumers fast, reliable and secure online connections on their favorite devices at home and on the go in high-value packages. We have completed deals with major programmers to deliver better flexibility and greater value to our customers by including seamless entertainment applications with certain of our Spectrum TV packages at no additional cost. In July 2025, we began launching the sale of these seamless entertainment applications to customers on an à la carte basis, and we recently launched the Spectrum App Store, a digital storefront that helps customers activate, upgrade, buy and manage their streaming applications in one place. We also continue to evolve other elements of our video product and are deploying Xumo stream boxes to new video customers.
p. 80 · Read in context →
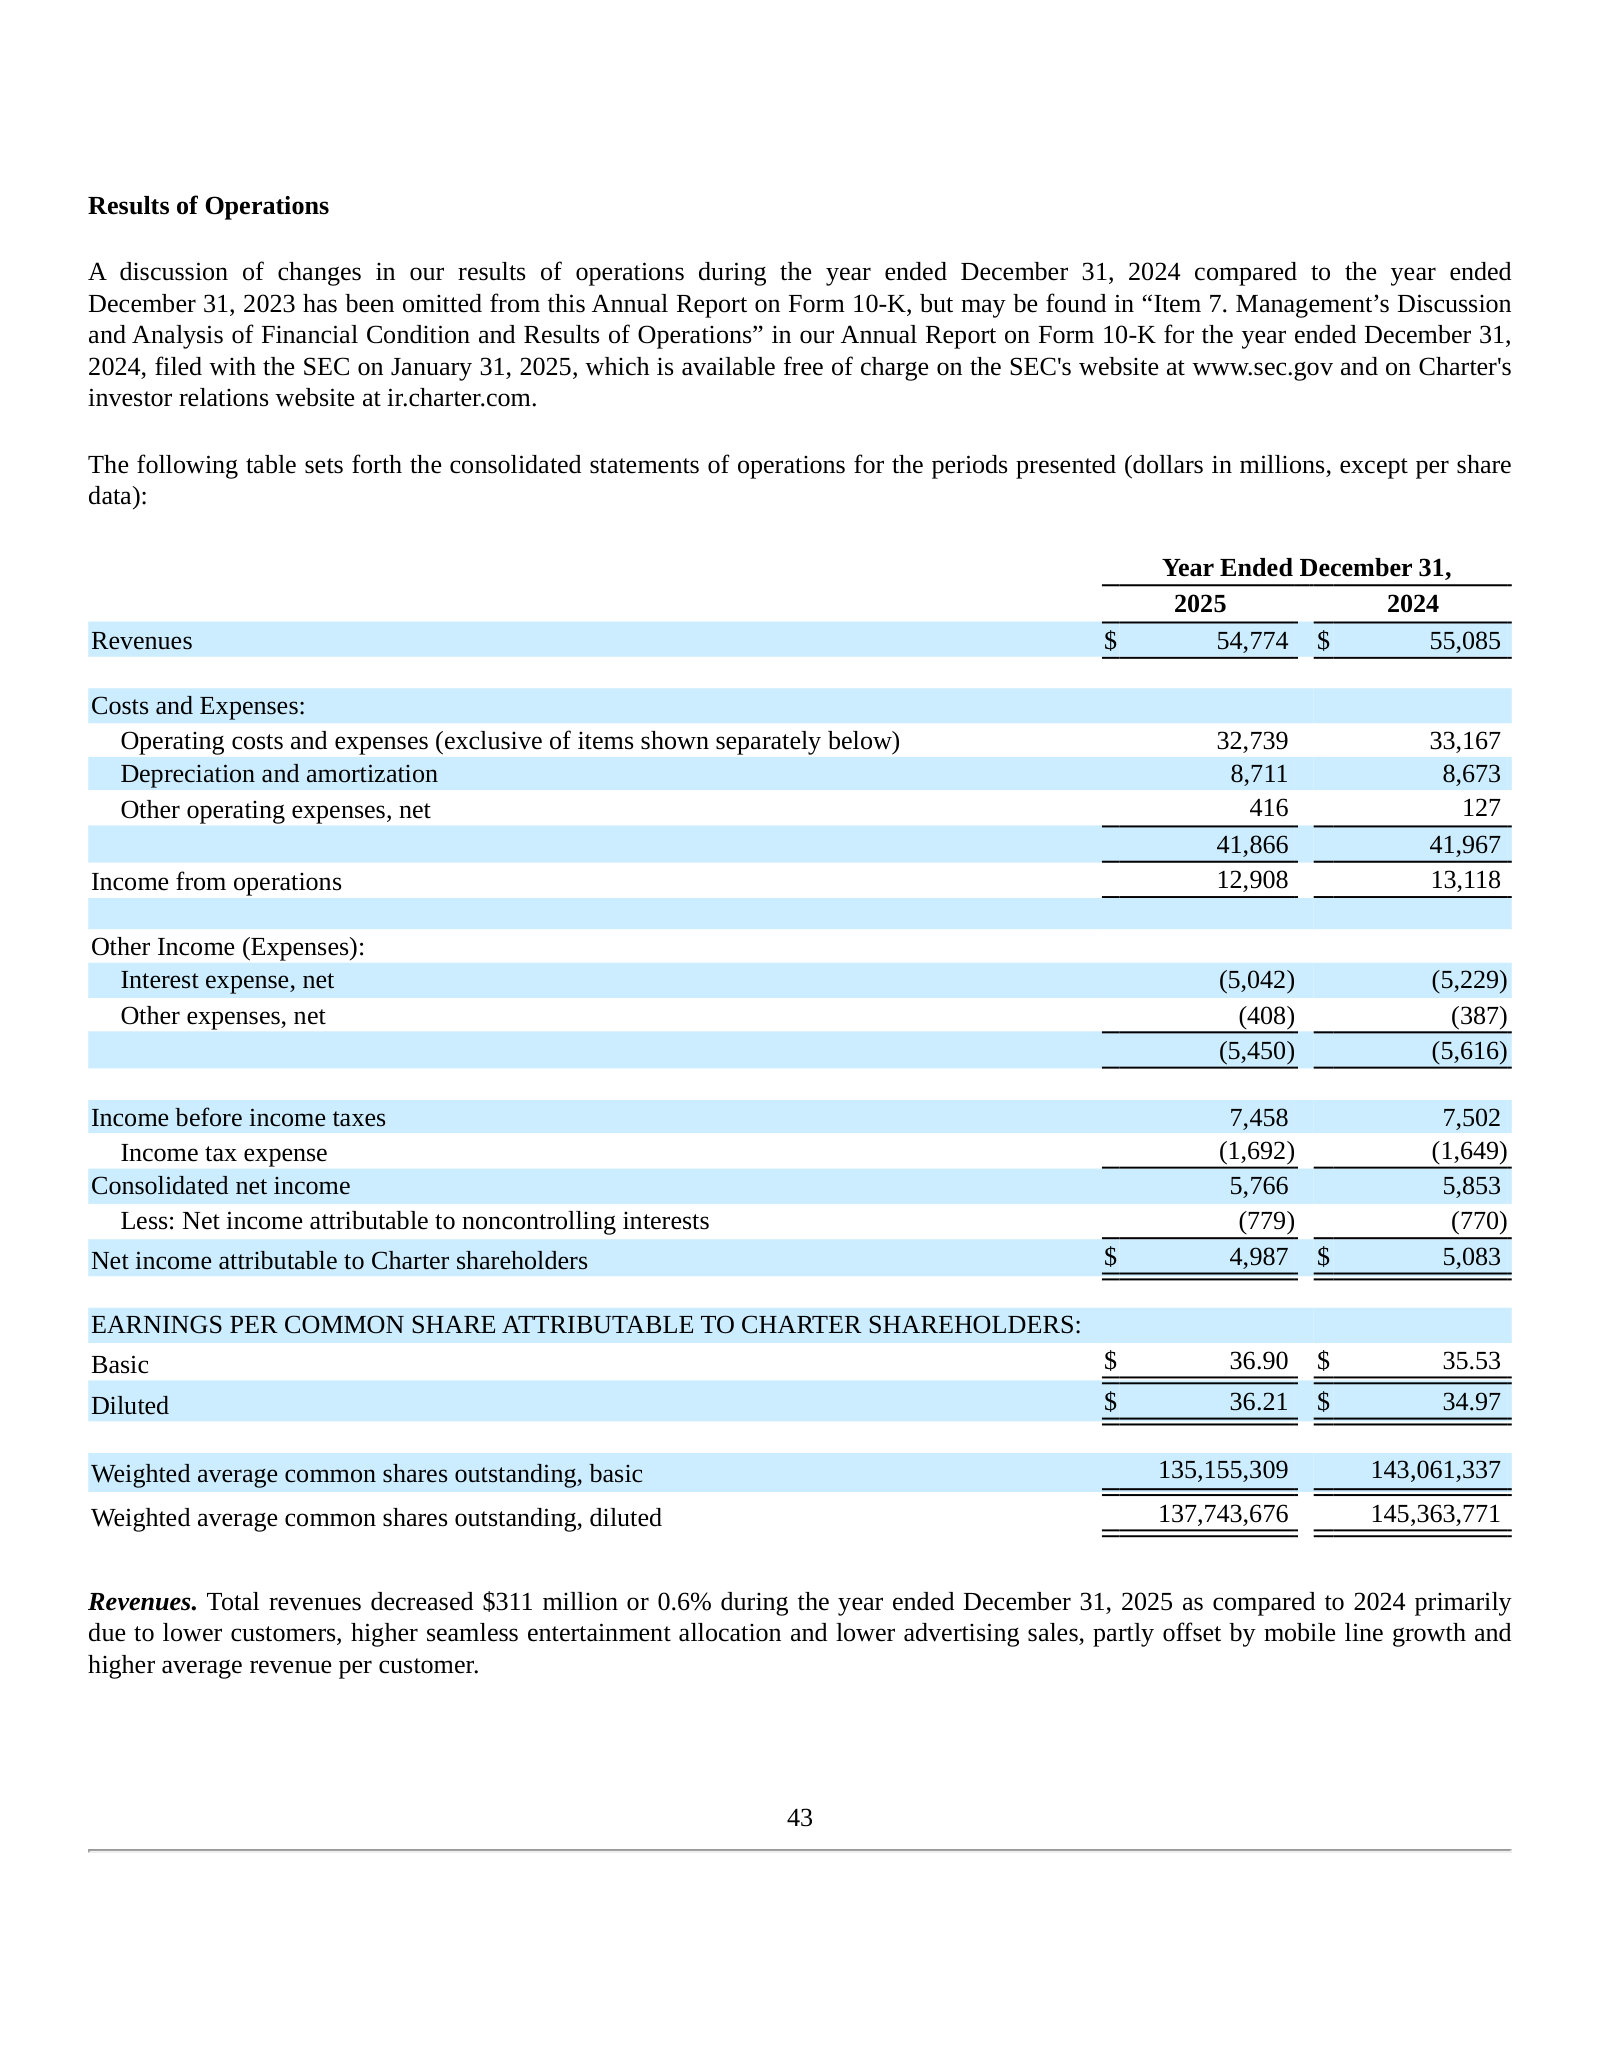
Critical Accounting Policies — Valuation and Impairment of Franchises and Goodwill — p. 84 · Read the full section →
Why the balance sheet is what it is: ~$67.5B of indefinite-lived franchise rights plus ~$29.7B goodwill — two-thirds of total assets.
Franchise intangibles ~$67.5B (44% of assets) and goodwill ~$29.7B (19%), both carried at indefinite life.
The carrying value of franchise intangibles as of both December 31, 2025 and 2024 was approximately $67.5 billion (representing 44% and 45% of total assets, respectively), and the carrying value of goodwill as of both December 31, 2025 and 2024 was approximately $29.7 billion (representing 19% and 20% of total assets, respectively).
p. 84 · Read in context →
Use of Adjusted EBITDA and Free Cash Flow — p. 94 · Read the full section →
The lens management and the board actually run the company by — the same measure that gates its debt covenants.
Adjusted EBITDA and free cash flow: how Charter measures performance and covenant compliance.
Management and the Board of Directors of Charter use Adjusted EBITDA and free cash flow to assess our performance and our ability to service our debt, fund operations and make additional investments with internally generated funds. In addition, Adjusted EBITDA generally correlates to the leverage ratio calculation under our credit facilities or outstanding notes to determine compliance with the covenants contained in the facilities and notes (all such documents have been previously filed with the SEC). For the purpose of calculating compliance with leverage covenants, we use Adjusted EBITDA, as presented, excluding certain expenses paid by our operating subsidiaries to other Charter entities. Our debt covenants refer to these expenses as management fees, which fees were in the amount of $1.4 billion and $1.5 billion for the years ended December 31, 2025 and 2024, respectively.
p. 94 · Read in context →
Note 14. Revenues — p. 168 · Read the full section →
How the money actually splits: Internet and mobile now carry the mix as video and voice decline.
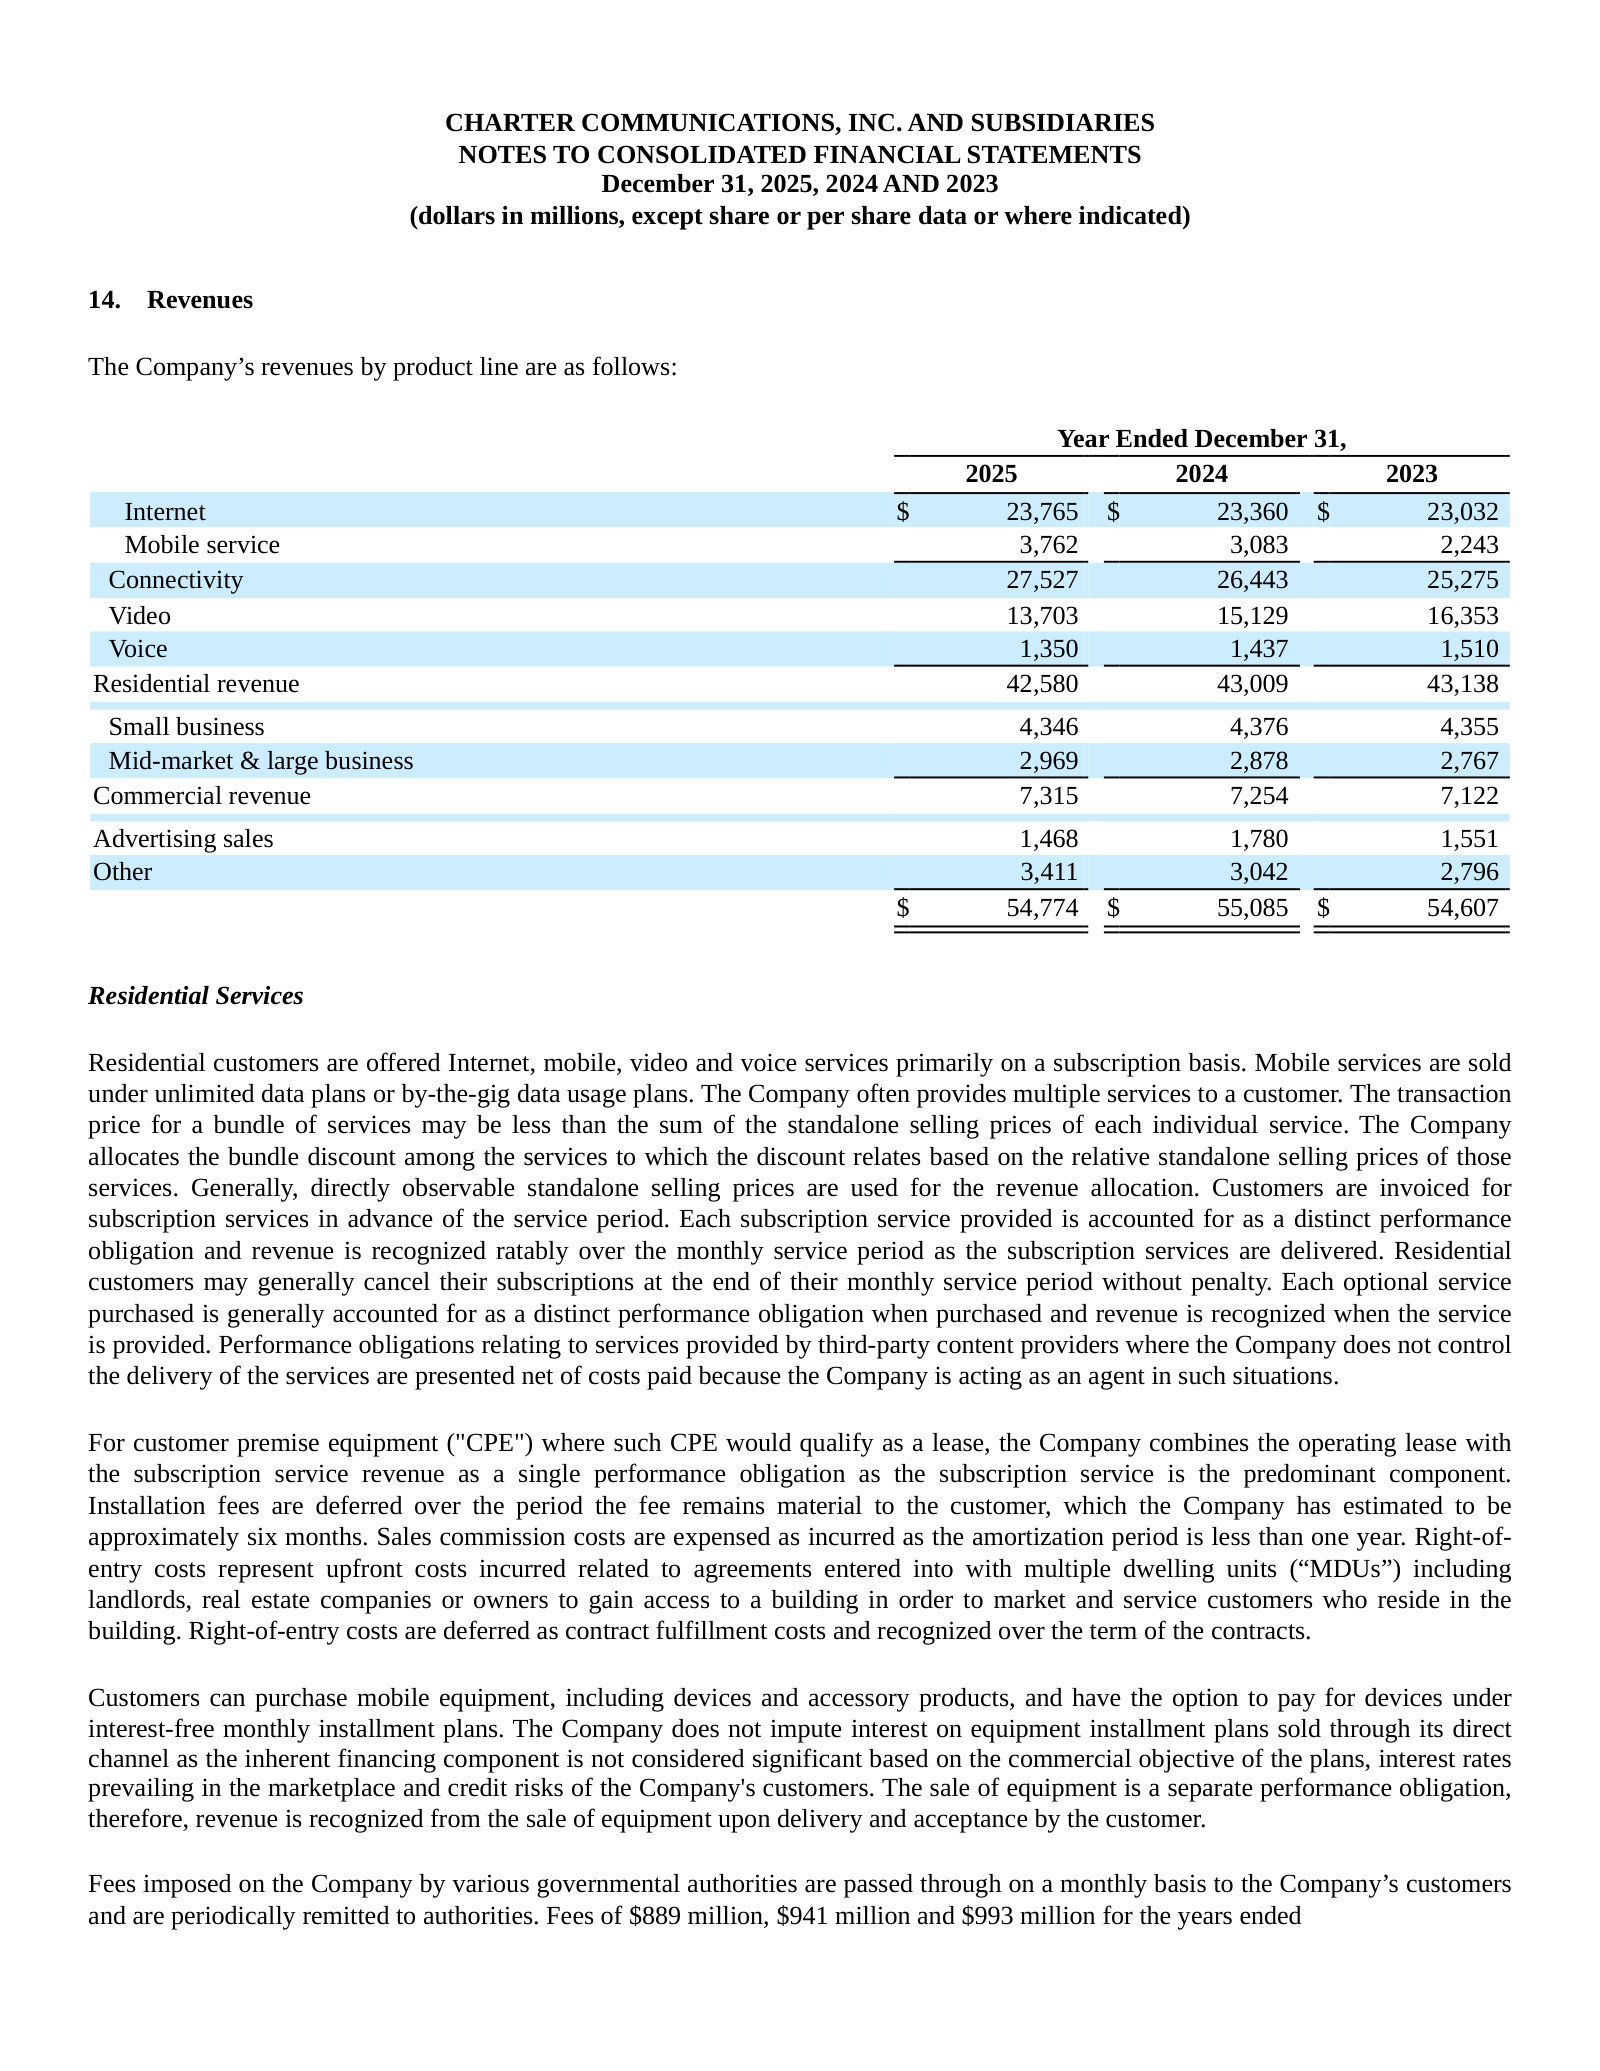
More annual reports
Charter Communications — FY2024 Annual Report (Form 10-K) — FY2024 · 183 pages · The prior-year baseline before the Cox and Liberty Broadband deals and the Q4 2025 customer-metric redefinition. · Open →
Charter Communications — FY2023 Annual Report (Form 10-K) — FY2023 · 174 pages · Peak of the rural construction and network-evolution capital cycle as broadband growth began to stall. · Open →
Charter Communications — FY2022 Annual Report (Form 10-K) — FY2022 · 165 pages · The year the subsidized rural build began and Spectrum Mobile scaled — the pivot toward converged connectivity. · Open →
Charter Communications — FY2021 Annual Report (Form 10-K) — FY2021 · 181 pages · Pre-pivot view: broadband still adding subscribers briskly, before competition and mobile reshaped the story. · Open →
Source: S&P Capital IQ consensus via Xpressfeed · Generated 2026-07-23.
Estimate momentum
The FY28 normalized-EPS mark has dropped from about $54.7 ninety days ago to $45.5 today; revenue for the same year is off roughly 2% over that window.
Currency: USD · Scale: money in millions, absolute · Point-in-time consensus; Δ90d is Now versus 90d.
| Metric | FY | 180d | 90d | 30d | Now | Δ90d |
|---|---|---|---|---|---|---|
| EPS (normalized) | FY2027 | $47.37 | $47.54 | $44.67 | $44.50 | -6.4% |
| EPS (normalized) | FY2028 | $46.51 | $54.69 | $47.17 | $45.46 | -16.9% |
| Revenue | FY2027 | $55.30bn | $54.43bn | $53.90bn | $53.75bn | -1.3% |
| Revenue | FY2028 | $56.24bn | $54.92bn | $54.11bn | $53.84bn | -2.0% |
Revenue keeps printing in-line; normalized EPS has missed three of the last four quarters
Revenue surprises have stayed inside ±1% every quarter, so guidance reads as fair-value on the top line while the earnings line is where estimates and prints keep diverging.
Current sequences by metric: Revenue: 1 consecutive beat; EPS (normalized): 1 consecutive miss.
Currency: USD · Scale: money in millions, absolute · Consensus is captured before each actual first became effective.
| Quarter | Metric | Consensus | Actual | Surprise | Outcome |
|---|---|---|---|---|---|
| Q1 FY2026 | Revenue | $13.54bn | $13.60bn | +0.4% | Beat |
| Q1 FY2026 | EPS (normalized) | $10.07 | $9.17 | -9.0% | Miss |
| Q4 FY2025 | Revenue | $13.73bn | $13.60bn | -1.0% | Miss |
| Q4 FY2025 | EPS (normalized) | $9.83 | $10.42 | +6.1% | Beat |
| Q3 FY2025 | Revenue | $13.75bn | $13.67bn | -0.6% | Miss |
| Q3 FY2025 | EPS (normalized) | $9.32 | $8.34 | -10.5% | Miss |
| Q2 FY2025 | Revenue | $13.76bn | $13.77bn | +0.0% | Beat |
| Q2 FY2025 | EPS (normalized) | $9.77 | $9.18 | -6.1% | Miss |
| Q1 FY2025 | Revenue | $13.67bn | $13.73bn | +0.5% | Beat |
| Q1 FY2025 | EPS (normalized) | $8.59 | $8.42 | -2.0% | Miss |
| Q4 FY2024 | Revenue | $13.88bn | $13.93bn | +0.3% | Beat |
| Q4 FY2024 | EPS (normalized) | $9.17 | $10.10 | +10.2% | Beat |
| Q3 FY2024 | Revenue | $13.66bn | $13.79bn | +1.0% | Beat |
| Q3 FY2024 | EPS (normalized) | $8.49 | $8.82 | +3.9% | Beat |
| Q2 FY2024 | Revenue | $13.60bn | $13.69bn | +0.7% | Beat |
| Q2 FY2024 | EPS (normalized) | $8.00 | $8.49 | +6.2% | Beat |
Flat revenue and EBITDA, but EPS and free cash flow keep climbing as net debt falls
Free cash flow rises from roughly $4.9bn in FY26 toward $8.4bn in FY29 as net debt falls from about $93bn to $81bn, the mechanism behind EPS growth on a flat top line.
Currency: USD · Scale: money in millions, absolute · YoY uses the prior fiscal year from the feed; analyst count and range use the first displayed period.
| Metric | FY2026E | FY2027E | FY2028E | FY2029E | YoY | Analysts | Low / high |
|---|---|---|---|---|---|---|---|
| Revenue | $54.22bn | $53.75bn | $53.84bn | $53.69bn | -1.0% | 18 | $53.94bn / $54.37bn |
| EBITDA | $22.43bn | $22.05bn | $21.98bn | $22.51bn | -1.2% | 18 | $21.46bn / $22.81bn |
| EPS (normalized) | $41.96 | $44.50 | $45.46 | $45.26 | +15.6% | 9 | $37.45 / $48.94 |
| Free cash flow | $4.91bn | $6.16bn | $7.32bn | $8.43bn | -1.6% | — | — |
| Net debt | $93.41bn | $90.52bn | $86.72bn | $80.96bn | — | — | — |
Where the street disagrees
The FY28 EPS range rests on single-digit analyst counts—read it as uncertainty, not a consensus view.
Currency: USD · Scale: money in millions, absolute · Spread/mean is absolute high-low divided by absolute mean.
| Metric | Period | Mean | Low–high | Spread/mean | Analysts |
|---|---|---|---|---|---|
| EBITDA | FY2027E | $22.05bn | $20.36bn–$22.91bn | 11.6% | 16 |
| EPS (normalized) | FY2027E | $44.50 | $32.79–$51.29 | 41.6% | 9 |
| EPS (normalized) | FY2028E | $45.46 | $29.24–$55.13 | 56.9% | 7 |
Street snapshot
The mean target near $210 sits well below the $413 high, and eleven of the covering analysts rate the stock hold against five buys.
Currency: USD · Scale: money in millions, absolute · Analyst counts shown explicitly.
| Street view | Reading | Analysts |
|---|---|---|
| Recommendation mix | Buy 5, Outperform 0, Hold 11, Underperform 2, Sell 3 | 21 |
| Consensus score | 2.90 | 21 |
| Target price | mean $209.9; median $190.0; high $413.0; low $120.0 | 17 |
Outer-year coverage thins sharply
FY29 revenue and EBITDA rest on four analysts and FY28 normalized EPS on seven, versus 16–19 covering the current year; treat the outer-year means and ranges shown here as fragile.
Visible Alpha broker models via S&P Xpressfeed · 19 brokers · 441 line items · freshest revision 2026-07-22.
The street models Charter as a business with roughly flat revenue and EBITDA where nearly all the value creation comes from a capex cliff and a shrinking share count. Mobile is the sole growth engine, adding lines and revenue while broadband loses subscribers and video and voice decline. Broadband revenue holds up because ARPU rises even as subscribers fall. The real debate is not the near term but how far free cash flow per share climbs by FY-2028 as spending winds down and buybacks continue.
Free cash flow is the story: capex rolls off and FCF/share inflects sharply higher
EBITDA barely moves across the set, so the entire free-cash-flow ramp is a capex-cliff story as line-extension and rural-build spending winds down.
| Line | FY-2025A | FY-2026E | FY-2027E | FY-2028E | YoY | Brokers |
|---|---|---|---|---|---|---|
| Cash flow | — | — | — | — | — | — |
| Free cash flow - Company defined | $4.90bn | $4.91bn | $6.04bn | $7.58bn | +0.3% | 17 |
| Free Cash flow per share - Company defined($) | $35.07 | $40.35 | $57.21 | $88.77 | +15.1% | 17 |
| Spend | — | — | — | — | — | — |
| Purchases of property, plant and equipment | $11.51bn | $11.43bn | $9.49bn | $7.87bn | -0.7% | 17 |
| Line extensions- Capex | $4.01bn | $3.24bn | $2.30bn | $1.95bn | -19.2% | 15 |
| Profit | — | — | — | — | — | — |
| EBITDA - operating | $22.62bn | $22.51bn | $22.12bn | $22.19bn | -0.5% | 19 |
Mobile is the only growth engine as legacy lines fade
Mobile now carries the top line; broadband revenue is roughly flat while video and voice shrink every year, leaving total revenue essentially flat across the models.
| Line | FY-2025A | FY-2026E | FY-2027E | FY-2028E | YoY | Brokers |
|---|---|---|---|---|---|---|
| Mobile (growth) | — | — | — | — | — | — |
| Residential - Mobile service revenue | $3.80bn | $4.35bn | $4.89bn | $5.44bn | +14.7% | 18 |
| Total mobile lines(K#) | 11.87m Number | 13.29m Number | 14.69m Number | 15.94m Number | +12.0% | 13 |
| Legacy (fading) | — | — | — | — | — | — |
| Residential - Internet revenue | $23.79bn | $23.38bn | $23.16bn | $23.00bn | -1.7% | 18 |
| Residential - Video revenue | $13.79bn | $12.64bn | $12.05bn | $11.58bn | -8.3% | 18 |
| Residential - Voice revenue | $1.36bn | $1.25bn | $1.10bn | $970.29m | -8.0% | 18 |
Broadband: subscribers keep eroding, pricing holds the revenue
The models have broadband losing subscribers every year with net losses not narrowing, yet residential internet ARPU rises through the period - pricing, not volume, defends the segment.
| Line | FY-2025A | FY-2026E | FY-2027E | FY-2028E | YoY | Brokers |
|---|---|---|---|---|---|---|
| Volume | — | — | — | — | — | — |
| Total internet subscribers(K#) | 29.66m Number | 29.18m Number | 28.69m Number | 28.18m Number | -1.6% | 17 |
| Internet - net adds(K#) | -416,437 Number | -503,039 Number | -489,421 Number | -505,651 Number | -20.8% | 17 |
| Price | — | — | — | — | — | — |
| ARPU - Residential Internet($) | $71.19 | $71.12 | $71.61 | $72.33 | -0.1% | 17 |
Where brokers split: FY-2028 free cash flow and the buyback pace
The debate is not this year's numbers but how fast capex falls and buybacks shrink the share count by FY-2028; the quartiles show a wide, economically material range.
| Line | Period | Median | Q1–Q3 | Min–max | Brokers |
|---|---|---|---|---|---|
| Free cash flow - Company defined | FY-2028E | $7.82bn | $7.25bn–$8.12bn | $5.99bn–$8.78bn | 13 |
| Free Cash flow per share - Company defined($) | FY-2028E | $83.64 | $80.06–$99.40 | $65.35–$119.4 | 8 |
| Capital expenditures excluding line extensions | FY-2028E | $6.05bn | $5.89bn–$6.27bn | $5.01bn–$6.91bn | 12 |
| Weighted average shares outstanding - Diluted(M#) | FY-2028E | 96.75m Number | 80.65m Number–107.50m Number | 65.48m Number–120.72m Number | 11 |
| EPS-Diluted($) | FY-2028E | $53.31 | $48.11–$66.34 | $39.24–$78.54 | 12 |
Buybacks turn flat cash flow into rising per-share value
Every model keeps repurchasing stock, cutting the diluted share count in each of the four years; that is why free cash flow per share and EPS climb far faster than the roughly flat EBITDA and revenue beneath them.
Coverage thins in the outer years and on the capex splits
Headline lines carry 13 to 17 brokers on fresh July 2026 marks, but FY-2028 FCF/share rests on 8 brokers, total mobile revenue on 6, and rural-construction capex on as few as 5 - read the outer-year spread as real uncertainty, not noise.
Headline P&L consensus, momentum and beat/miss live in the CapIQ tab.
Source: S&P Capital IQ transcripts via Xpressfeed · latest indexed call 2026-04-24 · generated 2026-07-23.
Latest call digest
Charter Communications, Inc., Q1 2026 Earnings Call, Apr 24, 2026 · 2026-04-24T12:30:00
Q1 2026 call, April 24, 2026. Prepared remarks led with the strengths: Spectrum Mobile added 370,000 lines (over 12 million total, up more than 17% over 12 months), video losses narrowed to 60,000 from 181,000 a year earlier, and management walked through its "three building blocks" (network, products/pricing, service) plus the pending Cox close, now cleared everywhere except California with a summer target. The Q&A reality was more pointed: internet still lost 120,000 customers, revenue fell 1%, and analysts pressed on flat broadband ARPU, the still-negative subscriber trajectory, and whether Charter needs to get more aggressive after Comcast's inflection. Guidance actually stated on the call: 2026 capex of approximately $11.4 billion, run-rate capex below $8 billion after the evolution/expansion programs, slight full-year EBITDA growth excluding transition costs, cash taxes of $500 million to $800 million, and Cox synergies raised to at least $800 million. Management declined to commit to a 2026 broadband price increase and framed the core problem as "top of funnel" demand rather than churn or pricing.
Participant coverage from the latest call.
| Group | Participants | Count |
|---|---|---|
| Management | Operator; Stefan Anninger — Vice President of Investor Relations, Charter Communications, Inc.; Christopher Winfrey — President, CEO & Director, Charter Communications, Inc.; Jessica Fischer — Chief Financial Officer, Charter Communications, Inc. | 4 |
| Analysts | Sean Diffley — Equity Analyst, Morgan Stanley, Research Division; Craig Moffett — Co-Founder, Founding Partner Senior Managing Director & Senior Research Analyst, MoffettNathanson LLC; Vikash Harlalka — Director on the US Communications Services Team & Lead Analyst, New Street Research LLP; John Hodulik — MD, Sector Head of the United States Communications Group and Telco & Pay TV Analyst, UBS Investment Bank, Research Division; Sebastiano Petti — Analyst, JPMorgan Chase & Co, Research Division; Steven Cahall — Senior Analyst, Wells Fargo Securities, LLC, Research Division | 6 |
Curated latest-call exchanges; one row per analyst topic.
| Analyst | Firm | Topic | What changed in Q&A |
|---|---|---|---|
| Sean Diffley | Morgan Stanley | Appetite and regulatory room for further cable M&A | Winfrey said Charter likes cable as an investment and would acquire more assets at an appropriate price, but has nothing underway beyond closing Cox; framed cable operators as regional players competing against national and global rivals. |
| Craig Moffett | MoffettNathanson | Pace of migrating Cox's higher broadband ARPU to Spectrum pricing | Winfrey argued customer-level ARPU and EBITDA margin are similar to Charter's, so lower broadband pricing would be offset by mobile and video attach; migration paced through loyalty offers as done with prior deals. |
| Vikash Harlalka | New Street Research | Whether pricing levers are exhausted and broadband ARPU can accelerate | Management said it keeps testing offers including multi-year price locks but sees no reason to change strategy; expects full-year internet ARPU growth to land close to flat either way depending on offer tuning. |
| John Hodulik | UBS | Competitive intensity across fixed wireless, fiber and LEO satellite | Winfrey framed the issue as top-of-funnel demand rather than churn, said fiber overbuild pace is unchanged and share holds in mature overlap, and characterized satellite as possibly more friend than foe with no major share loss yet. |
| Sebastiano Petti | JPMorgan | EBITDA growth ex-transition costs and a possible 2026 broadband price increase | Fischer reaffirmed the plan for slight EBITDA growth aided by political advertising; Winfrey said no determination has been made on a broadband price increase and stressed keeping pricing low. |
| Steven Cahall | Wells Fargo Securities | Whether to get more aggressive after Comcast's subscriber inflection | Winfrey said the issue is messaging value and service reputation rather than offer expression or added spend, and attributed the year-over-year gross-add variance largely to offer gaps in the low-income segment. |
Theme tracker
Themes are curator-classified across supplied calls.
| Theme | Status | Quarters mentioned | Read-through |
|---|---|---|---|
| Mobile and convergence growth | persisted | Q2 2023, Q3 2023, Q4 2023, Q1 2024, Q2 2024, Q3 2024, Q4 2024, Q1 2025, Q2 2025, Q3 2025, Q4 2025, Q1 2026 | The consistent bright spot and the lever management leans on to offset broadband weakness; roughly 2 million lines added per year, framed as an extension of broadband rather than a standalone product. |
| Fiber overbuild and fixed wireless competition | persisted | Q2 2023, Q3 2023, Q4 2023, Q1 2024, Q2 2024, Q3 2024, Q4 2024, Q1 2025, Q2 2025, Q3 2025, Q4 2025, Q1 2026 | A constant: management's view that fiber overbuild returns are poor and its share holds above competitors in mature overlap has not changed, while fixed wireless (notably AT&T) is the newer, still-growing pressure. |
| ACP subscriber wind-down | dropped | Q3 2023, Q4 2023, Q1 2024, Q2 2024, Q3 2024, Q4 2024, Q1 2025 | The dominant broadband headwind through 2024, with per-quarter loss quantification; declared behind the company in early 2025 and essentially absent since, removing a major recurring disclosure item. |
| Video turnaround and seamless entertainment | emerged | Q3 2024, Q4 2024, Q1 2025, Q2 2025, Q3 2025, Q4 2025, Q1 2026 | New pricing/packaging from September 2024 plus included streaming apps turned video from ~400K quarterly losses toward flat-to-positive, now pitched primarily as a broadband acquisition and retention tool rather than a standalone goal. |
| Cox acquisition and integration | emerged | Q2 2025, Q3 2025, Q4 2025, Q1 2026 | Announced May 2025; by Q1 2026 it dominates prepared remarks and Q&A, with synergies raised to at least $800 million and a summer 2026 close targeted pending California approval. |
| Capex peak and free cash flow inflection | persisted | Q2 2023, Q3 2023, Q4 2023, Q1 2024, Q2 2024, Q3 2024, Q4 2024, Q1 2025, Q2 2025, Q3 2025, Q4 2025, Q1 2026 | The capex-peaks-then-free-cash-flow-surges story with run-rate capex below $8 billion is repeated every quarter; 2025 was confirmed as the peak year at $11.66 billion, with the step-down still ahead. |
| AI and cost-to-serve efficiency | emerged | Q1 2025, Q2 2025, Q3 2025, Q4 2025, Q1 2026 | Machine-learning service tooling escalated into an explicit Agentic AI cost narrative from Q3 2025, framed as a multi-year tailwind to the roughly $8 billion cost to serve, with benefits management placed 12 to 18 months out. |
Guidance ledger
Quotes, calls, and speakers are source-verified; outcomes are curator-classified.
| Verbatim guidance | Call | Speaker | Curator outcome | Outcome note |
|---|---|---|---|---|
| “We continue to expect total 2025 capital expenditures to reach approximately $12 billion, and we have not changed our multiyear capital outlook.” | Charter Communications, Inc., Q1 2025 Earnings Call, Apr 25, 2025 · 2025-04-25T12:30:00 | Jessica Fischer | missed | Guidance was cut to approximately $11.5 billion mid-year and 2025 capex finished at $11.66 billion, per the Q4 2025 call. |
| “We still expect under existing tax legislation that our calendar year 2025 cash tax payments will total between $1.6 billion and $2 billion.” | Charter Communications, Inc., Q1 2025 Earnings Call, Apr 25, 2025 · 2025-04-25T12:30:00 | Jessica Fischer | missed | New federal tax legislation lowered the actual figure sharply; full-year 2025 cash taxes came in just under $900 million, per the Q4 2025 call. |
| “We continue to expect rural passings growth of approximately 450,000 in 2025, our biggest year so far, in addition to continued nonrural construction and fill-in activity.” | Charter Communications, Inc., Q1 2025 Earnings Call, Apr 25, 2025 · 2025-04-25T12:30:00 | Jessica Fischer | kept | Subsidized rural passings grew over 483,000 in the trailing 12 months by Q4 2025, above the 450,000 target. |
| “We expect total 2026 capital expenditures to reach $11.4 billion.” | Charter Communications, Inc., Q4 2025 Earnings Call, Jan 30, 2026 · 2026-01-30T13:30:00 | Jessica Fischer | pending | Reaffirmed at approximately $11.4 billion on the Q1 2026 call; full-year outcome not yet in the supplied history. |
| “For the full year 2026, we are planning for slight EBITDA growth, excluding the impact of transition costs.” | Charter Communications, Inc., Q4 2025 Earnings Call, Jan 30, 2026 · 2026-01-30T13:30:00 | Jessica Fischer | pending | Reiterated on the Q1 2026 call; management noted first-half EBITDA would be more challenged than the second half. |
| “We expect subsidized rural passings growth of approximately 450,000 in 2026, our last large build year, in addition to continued nonrural construction and fill-in activity.” | Charter Communications, Inc., Q4 2025 Earnings Call, Jan 30, 2026 · 2026-01-30T13:30:00 | Jessica Fischer | pending | Full-year 2026 result not available in the supplied call history. |
| “We now estimate transaction synergies, or run rate operating expense synergies, of at least $800 million and are likely to grow that further.” | Charter Communications, Inc., Q1 2026 Earnings Call, Apr 24, 2026 · 2026-04-24T12:30:00 | Jessica Fischer | pending | Raised from a prior $500 million estimate; realization depends on the Cox close, targeted for summer 2026. |
Q&A pressure map
Question counts and firms are curator tallies; analyst coverage shown above.
| Topic | Questions | Firms | Pressure / response |
|---|---|---|---|
| Return to broadband subscriber growth and the top of the funnel | 4 | MoffettNathanson, UBS, Wells Fargo Securities, Wolfe Research | The most persistent line of pressure across the recent calls. Management engages the question directly, attributing weakness to macro factors (housing, low move rates, mobile substitution) and new competition rather than churn or pricing, but has not committed to a timeline for a return to growth. |
| Cox integration and migrating its higher broadband ARPU | 4 | MoffettNathanson, Morgan Stanley, JPMorgan, Raymond James | Analysts probed pace of base migration, synergy sources and mobile/video penetration upside. Management consistently redirects from single-product broadband ARPU to customer-level ARPU and margin preservation. |
| Broadband ARPU and pricing strategy | 4 | New Street Research, JPMorgan, Citigroup, Morgan Stanley | Repeated questions on whether pricing levers are exhausted, price locks, and everyday-value pricing. On a 2026 broadband price increase, management plainly declined to commit, which is a deferral rather than an evasion. |
| EBITDA growth durability and reliance on political advertising | 3 | New Street Research, JPMorgan, Morgan Stanley | Analysts pushed on how much growth is underlying versus political-ad tailwind. Management answered with the offsetting drivers (mobile, mix, cost efficiency) but acknowledged the growth is close to the line. |
Language shifts
Only language evidence verified against the referenced component is shown.
| Observation | Verbatim evidence | Call ID | Component |
|---|---|---|---|
| In Q4 2025 management adopted a 'game of inches' framing to describe how narrow the path back to broadband net additions had become, a more hedged tone than in prior years. | “getting back to positive net additions is a game of inches” | 1974724673 | 2 |
| On the same call, management for the first time explicitly declined to project broadband customer growth for the year, leaning on trajectory rather than a growth commitment. | “I'm not projecting broadband relationship growth this year, but we expect to see an improved trajectory from the investments we've made over the past 3 years” | 1974724673 | 2 |
| In Q1 2026 management reframed the diagnosis as a demand/consideration problem at the top of the funnel rather than churn or product, with yield and churn described as strong. | “our issue right now really is top of funnel issue” | 1989468556 | 21 |
| In Q4 2025 the CFO openly named the market's negative-perpetuity-growth view of the stock as the perception the company must overcome, an unusually direct acknowledgment of the bear case. | “to overcome the perception of negative perpetuity growth implied in our valuation today, we need to win in the marketplace” | 1974724673 | 3 |
The call history sketches a company executing well on mobile, video and cost efficiency while broadband subscribers keep leaking, and management's tone has shifted from confident growth projections toward hedged 'game of inches' language. The current debate turns on whether the Cox deal, network upgrades and an eventual normalization in housing and competition restore broadband growth before the mechanical free-cash-flow step-up has to carry the story on its own.
Competitors describe Charter Communications, Inc.'s market in their own filings and calls. These verified passages and visual pages show where their strategies meet, using source documents preserved in Sources.
Comcast Corporation (CMCSA)
Comcast (Xfinity) is Charter's closest business-model analog and largest cable peer — the same residential-broadband-plus-Xfinity-Mobile convergence strategy, fighting the same fixed-wireless and fiber-overbuild pressure. Its own scorecards are the sharpest external read on Charter's core business, and analysts explicitly benchmark the two against each other.
Comcast's characterization of the residential-broadband battlefield Charter shares — aggressive fixed-wireless marketing, rapid fiber overbuild, and elevated promotional convergence offers — on its most recent (Q1 FY2026) call.
Michael Cavanagh (Co-CEO): the competitive environment remains intense. Fixed wireless continues to market aggressively across our footprint. Fiber overbuild is moving at a rapid pace and promotional convergence offers remain elevated. We're not assuming this gets easier anytime soon.
p. 1 · Read in context →
T-Mobile US, Inc. (TMUS)
T-Mobile's 5G Home Internet is the single largest source of broadband-share loss for cable operators, and its mobile network competes with Charter's Spectrum Mobile. T-Mobile names Charter by name as a wireless competitor and frames cable operators as the 'incumbents' its fixed-wireless-and-fiber strategy is built to attack.
T-Mobile's FY2025 10-K names Charter Communications as a wireless competitor and lists cable among the broadband rivals its own service competes against — the two-way overlap with Spectrum in both mobile and home internet.
In addition, our wireless communications services competitors include numerous smaller and regional providers, including Charter Communications, Inc., Comcast Corporation EchoStar Corporation (“EchoStar”), Cox Communications, Inc., and Altice USA, Inc., many of which offer no-contract, postpaid and prepaid service plans. […] In addition to our wireless communications services, our broadband services compete against other broadband providers, including Cable, DSL and other Fiber broadband providers, other fixed wireless solutions, including AT&T and Verizon’s fixed wireless products, and satellite internet providers.
p. 13 · Read in context →
T-Mobile sizes its own broadband footprint — the fifth-largest U.S. ISP, 12m fixed-wireless customers, and a stated 40–45m home-passed-equivalent ambition across FWA and fiber — the scale of the home-internet threat pressing on Charter's residential base.
Srini Gopalan (COO): We are now the fifth largest Internet Service Provider. This year, we plan to add 100,000 fiber customers, primarily in the second half of the year. We believe in this business, which combines Fixed Wireless Access with our investment in fiber where the economics make sense. Together, these elements position us as a significant player in broadband, with 12 million FWA customers. If we consider these numbers in terms of fiber homes passed, assuming a 40% utilization rate, this equates to 30 million homes. Furthermore, with our intentions for Lumos and Metronet, we aim to reach between 12 million and 15 million households. This puts us at the equivalent of 40 million to 45 million homes passed in broadband.
p. 8 · Read in context →
T-Mobile's CEO frames cable operators like Charter as the “incumbents” it intends to attack with fixed wireless and fiber rather than acquire — positioning FWA and fiber as a deliberate share-taking play against Spectrum broadband.
Srinivasan Gopalan (President and CEO): Specifically, cable is not something we're interested in. We see our strength as attacking incumbents rather than becoming an incumbent. We see a huge opportunity to attack incumbents across fiber and fixed wireless access. That will be our key play.
p. 8 · Read in context →
Verizon Communications Inc. (VZ)
Verizon is simultaneously Charter's wholesale partner and its rival: Spectrum Mobile is an MVNO running on Verizon's network, while Verizon competes head-on through fixed wireless access, Fios fiber, and its Frontier fiber acquisition. Verizon names Charter by name on both sides of that relationship.
Verizon's CEO confirms a renewed long-term MVNO agreement with Charter (and Comcast) — the wholesale wireless deal that underpins Spectrum Mobile — even as Verizon's Frontier-expanded fiber and FWA overbuild Charter's broadband footprint.
Daniel Schulman (CEO): I'm also very pleased to announce that we have completed a comprehensive long-term agreement with Comcast and Charter to continue our partnership. We obviously can't reveal any of the details, but each of us agrees the partnership is on very solid footing financially, operationally, and strategically. It is an accretive deal that ensures their customers remain on the best network.
p. 2 · Read in context →
Verizon's 10-K competition section names Charter explicitly as a cable reseller buying bulk wholesale wireless from Verizon — capturing both sides of the Spectrum Mobile MVNO relationship: wholesale supplier and retail rival.
We also compete for retail activations with resellers that buy bulk wholesale service from wireless service providers, including Verizon, and resell it to their customers. Resellers include cable companies, such as Comcast Corporation and Charter Communications, Inc., and others. Several major cable operators also offer bundles with wireless services through strategic relationships.
p. 11 · Read in context →
Verizon's CFO sizes the broadband base competing with Spectrum internet at over 16m subscribers (10.5m+ on fiber), with Frontier and fixed wireless framed as the growth engines.
Anthony Skiadas (CFO): our broadband segment continues to grow in both fixed wireless access and fiber, including Frontier, which added nearly 500,000 net adds this past year. We now have over 16 million broadband subscribers, with more than 10.5 million on fiber.
p. 9 · Read in context →
AT&T Inc. (T)
AT&T is Charter's principal fiber overbuilder and a converged fiber-plus-wireless competitor. Its multi-year fiber build pushes directly into cable territory, and its CEO responds to analyst questions that name Charter's pricing behavior, positioning AT&T's product as better and priced below cable's 'umbrella.'
AT&T's 10-K sizes its consumer broadband base at ~14.7m customers — 10.4m fiber plus 1.5m fixed-wireless (Internet Air) connections — the scale it is deploying against cable broadband incumbents like Charter.
We provide broadband and internet services to approximately 14.7 million customers, including 10.4 million fiber broadband connections and 1.5 million AIA connections at December 31, 2025.
p. 12 · Read in context →
AT&T's CEO describes the convergence playbook that collides with Charter — using fixed wireless as a bridge to hold converged customers ahead of fiber, then migrating them to a more profitable fiber-plus-wireless bundle.
John Stankey (Chairman and CEO): in the consumer space, preceding in markets where we know we're going to have fiber and being aggressive about our deployment to hold converged customers. That growth is really good growth because the transition is from a broadband connection ultimately to a fiber connection, and that transition is a very profitable connection when you have a converged customer in that situation.
p. 9 · Read in context →
Altice USA, Inc. (Optimum) (ATUS)
Altice/Optimum is a direct U.S. cable peer with the same broadband/video/mobile model as Charter — and its 10-K names Charter by name as a national operator overbuilding fiber into Optimum's own footprint, a rare instance of a peer describing Charter as the aggressor.
Altice/Optimum's FY2025 10-K names Charter (with Comcast) as a national operator deploying fiber and network overbuilds into Optimum's footprint, alongside T-Mobile, Verizon and AT&T fixed wireless as its primary wireless-broadband competitors — direct evidence of Charter overbuilding a cable peer.
T-Mobile fixed wireless, Verizon fixed wireless, and AT&T Internet Air are our primary wireless broadband competitors. In addition to smaller and regional overbuilders, which use an existing telecommunications operator's network to provide their services, as well as newer fiber providers such as Tachus and T-Fiber, large national providers such as Comcast and Charter are currently deploying significant fiber and network overbuilds in portions of our footprint, increasing the intensity of competition in certain markets.
p. 12 · Read in context →
Cable One, Inc. (Sparklight) (CABO)
Cable One is a smaller, broadband-first cable operator facing the same fixed-wireless and fiber-overbuild pressures as Charter, in largely non-urban markets. Its management uses Charter as a scale reference point and maps the FWA/overbuild competition in its footprint.
Cable One's CEO names Charter as a scale benchmark — conceding it lacks Charter/Comcast-level programming leverage and instead leans on low-cost streaming add-ons to defend its broadband-only customers.
Jim Holanda (CEO): We do not have access to the same programming arrangements that would put us in the same bucket as a Comcast or Charter, obviously. But what we do have access to is a lot of fast channel integrated options at our disposal to enhance value for broadband customers.
p. 8 · Read in context →
Cable One's CEO maps the same competitive set weighing on Charter — one-to-three fixed-wireless carriers plus wireline rivals across its footprint, with fiber overbuilders in roughly 15% of it.
James Holanda (Chief Executive Officer): we're fighting off one, two, or three FWA carriers and wireline competitors and, in about 15% of the footprint, fiber overbuilders. We feel we have a good playbook to defend our base and grow connects simultaneously.
p. 6 · Read in context →
More peer documents
Comcast — Q4 FY2025 earnings call — Q4 FY2025 · 13 pages · Full-year broadband/wireless recap; management notes the MVNO arrangement spanning Comcast, Charter and Verizon (p2) — the shared cable wireless-economics backdrop. · Open →
AT&T — Q2 FY2025 earnings call — Q2 FY2025 · 12 pages · Stankey's fuller fiber build-out case — a plan to exceed 60m homes passed by 2030 while 'increasing our market share from cable' at 40%+ penetration (p9). · Open →
Verizon — FY2024 10-K — FY2024 · 198 pages · Prior-year competition section also names Charter as a cable reseller/MVNO (p13) — confirms the both-partner-and-rival framing trendline. · Open →
T-Mobile — FY2024 10-K — FY2024 · 210 pages · Prior-year 10-K names Charter as a wireless competitor and cable diversifying into wireless (p13, p23) — the naming trendline. · Open →
Altice USA (Optimum) — Q3 FY2025 earnings call — Q3 FY2025 · 11 pages · Hard subscriber trajectory for the direct cable peer — 58k broadband losses, 700k+ fiber customers at 23% penetration, 38k mobile line adds (p2). · Open →
Cable One — FY2025 10-K — FY2025 · 173 pages · Broadband-first model sizing (~1.0m customers, ~2.9m passings, data ~60% of revenue, p6) and Charter listed among principal competitors (p25, p67). · Open →
Fit
Does not fit the framework (P1 not met); contested: P2, P4a
Charter does not fit the framework. The decision is a gate, not a tally: the year-10 durability pillar (P1) is not met, and by the framework's own construction nothing downstream offsets a failed gate. The confidence tier is medium — the basis the tally records is that probability spreads were at most 0.25 or one non-load-bearing criterion was contested. No hard exclusion was hit, the name is not watchlist-only, and the masked-name re-run showed no prior-driven risk. Two criteria came back contested: P2 and P4a.
Universe and exclusions — unsoftened
Charter clears the universe screen and trips none of the hard exclusions. Both universe tests are met with cross-family agreement: it is a US primary listing — Class A common stock on the Nasdaq Global Select Market under CHTR, ISIN US16119P1084, incorporated in the US, no ADR structure [1] — and the equity market cap is $17.8 billion (price $129.22 on 2026-07-22 times 137,743,676 shares), above the $10 billion floor [2]. The counter-fact travels with it: that equity sits atop $94.3 billion of net debt, so enterprise value is roughly $112 billion and the market-cap gate measures a thin, deeply subordinated claim — 16% of EV.
Every exclusion screened clean (each returned not_met — the exclusion condition is not satisfied):
- Automotive / undifferentiated hardware (X1): Charter sells subscription broadband, mobile, video and voice under the Spectrum brand; no vehicle manufacturing. Not hit.
- Promotional CEO without skin in the game (X2): promise-versus-delivery reads candid — 2024 and 2025 capex each undershot guidance and 2025 cash taxes came in below a $1.6–2.0B guide — with the CEO a repeated open-market buyer, and management named its own bear case aloud [3]. The surviving counter-fact: insider economic ownership is small in percentage terms (all officers and directors 1.10%; the register is dominated by Liberty at 29.07% and Advance/Newhouse at 13.21%) and long-term incentives are heavily option-weighted [4]. Not hit.
- Structurally declining business (X3): the mechanical disqualifier — revenue falling high-single-digit for three consecutive years — is absent (consecutive_decline_years = 1; FY2025 revenue fell 0.6%). The counter-fact sits in the same breath: the profit core underneath, total Internet customers, has declined two years running and is the reason the temporary-versus-structural question goes to the trial. Not hit.
- Market darling (X4): the inverse of a crowded winner — the equity is down about 84% from its 2021 peak, trading near 0.3x sales and about 5x EV/EBITDA against its own roughly 10x ten-year median. This screen was weakened on one number (the local consensus target mean is $209.94, not a wider range), but the dislocation-not-darling conclusion held. Not hit.
- China exposure (S1): zero China revenue or assets; the 58-million-passing footprint and workforce are entirely US-based. Not hit.
Pattern match
Of the reader's four recognition setups, Charter most resembles the fourth — a quality duopoly on a fear dip — and, on the yield mechanics specifically, it is the framework's own levered archetype (the framework's ≥25% levered bar is anchored to Charter's capex-roll-off story). It fits none of the other three: it pays no dividend (ruling out the high-yield setup), it is not a bank (ruling out the cyclical-bottom setup), and it is not an insurer repricing a cost-trend miss (ruling out the healthcare-forecasting setup).
But the pattern-4 checks are exactly where it breaks. That setup rewards a specific, testable, temporary fear over a durable monopoly. Here the fear is testable but the trial could not confirm it is temporary (p_temporary = 0.36), and the durability gate the pattern presumes — a franchise very likely larger in ten years — is the pillar that fails. This is framing, not the verdict: the name looks like the levered path Charter itself defines, yet fails the prior gate that path still has to clear.
The pillar ledger
Source: deterministic fit tally (ruchir/fit_tally.json), per-criterion aggregates and vote splits.
Year-10 durability — the gate (P1)
The gate asks whether year-10 revenue and free cash flow will both be higher than today with very high conviction; any proper doubt fails it. The FCF leg is defensible — consensus models reported FCF rising from about $4.99B in FY2025 to about $8.43B by FY2029 as the network-evolution capex peak (now guided to finish in 2027) rolls off [5]. The revenue leg is where the doubt lives: total Internet customers fell from 30,588k (2023) to 30,080k (2024) to 29,680k (2025), and FY2025 residential Internet revenue rose only because roughly +$785M of rate offset −$380M from fewer customers [6]. Total revenue turned down 0.6% in FY2025, the first annual decline in the series. All four jurors across both families returned not_met; the trimmed-mean probability that year-10 revenue is higher with high conviction is 0.425, spread 0.03 — a tight cross-family agreement below the coin-flip line the gate demands. The strongest surviving counter-fact, in the same treatment: essential connectivity (Internet plus mobile) revenue still grew 4.1% to $27,527M in FY2025 and is half of revenue, mobile grew 22% off low penetration, and monthly usage compounds near 825 GB — so a flat-to-higher year-10 top line is plausible, just not high-conviction [7]. The market structure that would ordinarily carry conviction is a regional wireline duopoly (AT&T fiber overlaps about 27% of the footprint, Verizon about 16%), but it is porous to fixed wireless, which bypasses the last-mile plant entirely [8], and the franchises are explicitly non-exclusive with public subsidy flowing to new entrants [9]. Full treatment: Durability. This is the gate that decides the profile: P1 not met → does not fit.
FCF consistency (P2) — contested
Ruchir's consistency test wants a stable rolling five-year average FCF. On the reported series Charter passes: FCF has never been negative and the rolling five-year average is confined to a $4.07–5.83B band across 2020–2025, its year-to-year swings ($8.6B in 2021 to $3.2B in 2024) tracking the capex cycle rather than underwriting losses [10]. But the framework's preferred adjusted series (FCF minus SBC minus five-year-average acquisitions) is not_computable here because SBC is absent from the numeric feed for every year 2016–2025. That split is exactly why P2 came back contested: the two Claude jurors read the reported series as met; the two Codex jurors returned cannot_determine on the missing adjusted series. The counter-fact in the same breath: annual reported FCF nearly halved from $8,604M (2021) to $3,161M (2024), and because the adjusted basis cannot be formed, the SBC drag on the true series is unquantified. Full treatment: Durability.
Dislocation and yield (P3)
The entry trigger is genuinely present, but the yield sits below its bar today.
Dislocation occurred (P3a) — met. Charter fell 70.6% peak-to-trough, from a $427.25 close on 2025-05-16 to $125.54 on 2026-06-22 (402 days), and trades at $129.22. Two earnings days did most of the damage: −18.5% on 2025-07-25 and −25.5% on 2026-04-24, on broadband losses and EBITDA softness [11]. The counter-fact carried in the same treatment: the $427.25 peak was set on the 2025-05-16 Cox-merger announcement, so part of the fall is the unwind of deal enthusiasm rather than pure fear repricing [12]. Full treatment: Dislocation.
Capitulation volume (P3b) — met. Traded volume spiked to 3.88x the pre-peak median on the profile's 20-day-average gauge, with single sessions reaching 16.1x four days before the trough — emotion-driven selling peaking near the bottom, not the start of the slide. The honest counter-fact: on the smoothed 20-day definition, 3.88x is a real but moderate spike; the dramatic 8.7x/11.9x/16.1x multiples are single days. Full treatment: Dislocation.
Current yield vs bar (P3c) — not met. Charter is in the levered balance-sheet class — net debt of $94.3B against roughly $21.6B EBITDA is about 4.4x (4.15x on its own $22.7B Adjusted EBITDA) — so the reference line is 25%, not the 8–9% fortress or 10% moderate line [13]. On the framework's adjusted basis, FY2025 adjusted FCF (reported FCF $4,418M − SBC $673M − five-year-average acquisitions $0 = $3,745M) over the $17.8B market cap is 21.0%, or 16.6% on the three-year average — roughly 400 bps short of the 25% bar on the current year [14]. Counter-fact in the same treatment: management is deleveraging toward a 3.5–3.75x target, which lowers the risk the 25% bar is meant to price [15]. Full treatment: Yield.
Forward path clears bar (P3d) — met. Normalizing FY2025 operating cash flow for management's stated sub-$8B post-program capex run-rate lifts the adjusted yield to about 41% (a stressed alternate still gives about 30%), and consensus FCF clears 25% gross every forward year and by FY2027 on an SBC-adjusted basis [16]. The trimmed-mean probability the bar is cleared within three years is 0.76, spread 0.05. The residual risk carried alongside: revenue turned down 0.6% in FY2025 and residential Internet is losing roughly 120,000 subscribers a quarter — if EBITDA erodes faster than capex falls, the normalized yield compresses toward or through 25%. Full treatment: Yield.
Balance sheet and self-help (P4)
Outlast and capital allocation (P4a) — contested. Charter can comfortably outlast a multi-year subscriber problem without capital allocation being forced to paydown: near-term maturities are small ($1.1B / $3.6B / $5.4B in 2026 / 2027 / 2028, $10.0B over three years) against roughly $4.4B annual FCF plus a $4.4B undrawn revolver and $477M cash, the book is 87% fixed-rate, and covenant headroom is about two turns (cap 6.0x versus actual 4.0x) [17]. What splits the criterion: on the Q4 2025 call management cut post-Cox target leverage to the low end of 3.5–3.75x (from a 4.0–4.5x band), explicitly heeding shareholders' preference for less leverage — the framework's own falsifier of capital allocation tilting to paydown when the buyback tailwind should be maximal [18]. Two Claude jurors read the outlast headroom as met; two Codex jurors read the de-lever pivot as not_met. The counter-fact in the same treatment: management paired the pivot with a commitment to continued significant capital returns and framed the de-lever as coming largely from EBITDA growth, not from diverting FCF to gross paydown. Full treatment: Self-Help.
Repurchase engine executed (P4b) — met. This is executed, not merely authorized: roughly $71B of buybacks over 2016–2025 cut the share count 41% (from 234.8M to 137.7M, a −8.0% five-year CAGR), with SBC a negligible ~$673M/yr and no rising-count hard-fail on the record [19]. The counter-fact carried with it: the heaviest buyback years (2020–2022, roughly $37B) executed at $600–700 per share, far above today's $129, and the pending Cox close issues about 46M new shares — a roughly 30% one-time step-up — though that is a single equity-funded acquisition bringing Cox's cash flow, not serial dilution. Full treatment: Self-Help.
Dividend cover (P4c) — not applicable. Charter pays no dividend, so the return case rests entirely on repurchases and per-share FCF growth; the dividend-safety test does not apply.
Diagnosis — temporary or permanent (P5) — not met
The price destroyed roughly $44B of equity (−71%), but how much intrinsic value the problem destroyed depends entirely on the diagnosis. A temporary, capex-driven FCF trough destroys only about $5B of NPV — a roughly $39B gap that would be the mispricing. A permanent level-shift destroys about $39B, which nearly matches the price move and closes the gap [20]. The adversarial trial, blind judges on both reading orders, rated temporary at p_temporary = 0.36 (spread 0.22) — below the coin-flip line — so the mispricing gap only exists under the reading the trial found less likely. All four jurors returned not_met on the diagnosis. The strongest surviving counter-fact, in the same treatment: even under permanence, a declining-perpetuity intrinsic value is about $40.8B ($296/share) versus the $17.8B ($129/share) price, so the equity appears to overshoot unless it is discounted near 27% — which is defensible for a claim that is only 16% of a $112B enterprise value [21]. Full treatment: Damage Math.
Instrument context (I1) — not verifiable
Qualifying long-dated options appear to exist — the chain is described as extending to the 21 January 2028 LEAPS expiration, 18+ months out, with 30-day implied volatility around 70%, at or above the framework's 60–70 elevated band. Both facts are sourced to dated public web feeds (AlphaQuery, Market Rebellion, Investing.com, Public.com) that are not in the run corpus, so the skeptic could not verify them and all four jurors returned not_verifiable. Stated as a framework fact, not advice: on the corpus alone, instrument availability cannot be confirmed. Full treatment: Clock.
What a 3x-in-3-years would require
The framework's target test is stated as arithmetic, never a recommendation — and here the arithmetic is incomplete by the tally's own accounting. The tally records re-rating math unavailable because the applicable bar or normalized adjusted FCF is missing: the feature-level adjusted FCF and adjusted-FCF yield are not_computable (SBC absent from the numeric feed), so the price-at-bar-yield on normalized adjusted FCF, the implied market cap, and the upside-to-bar cannot be formed deterministically. The gate failure at P1 makes the target test moot for fit purposes regardless.
For context on what re-rating would mechanically involve, the surviving Yield and Clock claims show the shape: consensus reported FCF is modeled rising from about $4.99B (FY2025) to $8.43B (FY2029), which on today's $17.8B market cap is a forward yield climbing from roughly 28% to 47%, and on normalized FCF the entire float is retired in about 2.4–2.9 years [22]. Consensus would have to concede that the capex roll-off arrives on schedule and that revenue and EBITDA hold while it does — the exact condition the trial found only 36% likely.
The base rates from this name's own history cut against a fast round trip. Charter's two completed drawdowns of note were −35% (267 days to trough, reclaimed in 672 days) and −31.5% (30 days to trough, reclaimed in 100 days). The current fall — −70.6% acute, −84.7% from the September 2021 all-time high — is roughly twice as deep as anything the name has completed, so its own record supplies no base rate for a repair this size [23]. The framework's own precedents (Meta's roughly 90% peak-to-trough swings; Centene from about $90 to $25 and back toward $60) show quality franchises can round-trip deeper falls — but that is a cross-name precedent, not this name's.
Source: consensus estimates (CapIQ) via fit_features.consensus_forward_yield; capex roll-off per the Q4 FY2025 call [24]. Yields derived on the current $17.8B market cap.
Contested and undetermined
Two criteria were contested; nothing was left cannot-determine at the aggregate level.
- P2 (FCF consistency): the vote split 2 met, 2 cannot_determine (Claude jurors met on the reported FCF series; Codex jurors cannot_determine because the framework's adjusted series is not computable without SBC). Both readings stand: reported FCF is stable and never negative; the adjusted basis the framework actually prefers cannot be formed from the feed.
- P4a (outlast + capital allocation): the vote split 2 met, 2 not_met. The met reading: the balance sheet comfortably outlasts a multi-year problem. The not_met reading: management's post-Cox de-lever to the low end of 3.5–3.75x is capital allocation tilting toward paydown when the buyback tailwind should be maximal — the framework's own falsifier.
Provenance
Source: fit tally provenance block (ruchir/fit_tally.json) and skeptic refutation ledger (ruchir/refutations.json).
The verdict was pressed hard and held. Two independent model families sat the jury, and the one criterion that decides the profile — the P1 gate — drew a unanimous not_met across both families with a probability spread of just 0.03; re-running the jury with the company name masked flipped no gate and moved no probability by more than 0.01, so the result is not an artifact of the model knowing it was looking at Charter. Of the claims the skeptic recomputed in full, 15 survived, one was weakened on a secondary number (a consensus target range) without changing its conclusion, none were refuted, and the two unverifiable claims were the instrument-context (I1) facts sourced to web feeds absent from the corpus.
The falsifier ledger
These are the standing what-would-change-this conditions. The first five are the framework's own seed falsifiers; the rest are the name-specific versions with thresholds, direction, and window where defined.
Framework seeds:
- adjusted FCF or EBITDA declines where flat-or-better was underwritten
- revenue declines for a third consecutive year
- capital allocation pivots to debt paydown over repurchases
- share count inflects upward
- the industry repricing cycle fails to materialize where industry-wide mean reversion was underwritten
Name-specific (would flip the diagnosis toward temporary):
- Broadband net adds stabilize or turn positive for 3-4 consecutive quarters, ex-ACP.
- Post-2027 network-evolution completion, annual capex falls below ~$9B with FCF recovering above ~$7B for two straight years.
- Residential ARPU resumes durable YoY growth not driven by app-cost allocation/accounting.
- Residential Internet net adds turn positive for at least four consecutive quarters by FY2027.
- FY2027 capex drops below $9.0B and free cash flow exceeds $7.0B without worsening leverage.
- Residential revenue per customer and Internet revenue return to year-over-year growth excluding allocation effects.
- Consensus or company guidance for FY2028-FY2029 free cash flow above $8B becomes page-verifiable and survives later revisions.
- Conversely: FCF recovers toward $7-8B as capex rolls off with revenue stabilizing - confirms temporary trough.
Name-specific (would confirm permanence):
- Broadband losses keep widening and FCF stays at/below ~$4B through 2027 (confirms permanent).
- Broadband losses keep widening through 2026-2027 AND same-store ARPU (ex streaming-app reclass) also declines - volume-plus-price erosion = permanent.
- FY2026 capex misses the ~$11.4B guide and FY2027 fails to fall post-network-evolution - the 'peak' is a structural maintenance level, not a cycle.
- EBITDA decline accelerates beyond ~3%/yr - mild dip becomes a genuine earning-power downtrend.
Data gaps
What the run could not answer, from the tally's list:
- Adjusted FCF is not computable from the feed. SBC is absent from
data/financials/cash_flow.jsonfor every year 2016–2025, so the framework's adjusted-FCF series, its five-year average, the adjusted yield, the yield baseline, and float-retirement years are all not_computable. The Yield tab reconstructs adjusted FCF (~$3,745M FY2025) from the filed 10-K cash-flow pages (FY2025 p.140, FY2023 p.122, FY2021 p.114) and flags the substitution rather than treating the feature as authoritative. - Balance-sheet class returned "unknown" because EBITDA was absent from the feature feed for FY2025; leverage is instead computed from operating income plus D&A and cross-checked against the filed 4.15x on $22,708M Adjusted EBITDA (levered).
- Instrument context is off-corpus. Options existence, open interest, and implied volatility come from dated public web feeds, not the filing corpus; individual far-dated LEAPS open interest is described only at a high level (low thousands of contracts).
- Cox merger economics ($34.5B, ~36M combined broadband subscribers, targeted mid-2026 close) come from dated web research; the corpus documents the Liberty Broadband combination and references the Cox transactions but predates deal close, so pro forma combined FCF, share count, and per-share accretion are not yet in filed post-close statements.
- Short interest is unavailable: the run's short-interest feed returned zero rows for CHTR, so short-seller composition and any change through the fall cannot be quantified.
- Consensus revision history reaches back only ~180 days (to 2026-01-23), so the estimate path across the first, larger drawdown leg (May 2025 to January 2026) is not directly measured.
- Year-10 revenue and FCF are not disclosed by the company; the gate read rests on the observed unit and price trajectory, the network-evolution capex-rolloff timing (now 2027), and CapIQ consensus through FY2029.
- No filing labels broadband an "essential utility" or states recession/COVID demand resilience; the essentialness read is inferential from usage growth (~825 GB/month) and churn "at or below historic lows."
Business
Charter Communications sells subscription broadband, mobile, video and voice under the Spectrum brand to 29.6 million residential and 2.2 million small-business relationships across 41 states — the second-largest US cable operator, soon the largest once its Cox Communications merger closes. It clears the universe screen cleanly: US-listed on Nasdaq, market cap $17.8 billion, above the $10 billion line. It is the opposite of a consensus darling — the equity is down ~84% from its 2021 peak — and carries no China exposure. The market-structure evidence the durability question needs is laid out below.
What Charter is — orient from zero
Charter is a facilities-based broadband connectivity company: it owns a hybrid fiber-coaxial network passing 58 million homes and businesses across 41 states, and sells connectivity and entertainment over it under the Spectrum brand. Founded in 1993, it evolved from cable television into high-speed internet, and now into a converged internet-WiFi-mobile bundle [1], served by roughly 91,900 US-based employees [2]. Full-year revenue was $54.8 billion in FY2025.
The money is made by renting access to that network on a recurring monthly basis. Internet is the economic core — $23.8 billion of revenue, 43% of the total — with video the declining legacy at $13.7 billion (25%) and a fast-growing mobile line that reached $3.8 billion of service revenue [3].
Source: FY2025 Annual Report (Form 10-K), Note 14 Revenues [4].
The customer base is where the business is best understood, because Charter earns on relationships and lines, not units sold once. Video is in secular decline — cord-cutting has taken residential video from 16.8 million subscribers in 2016 to 12.1 million — while mobile is the growth engine, from a standing start in 2017 to 11.4 million lines. Residential internet, the profit center, grew for a decade to a peak of 28.5 million in 2023 and has since edged down to 27.6 million.
Residential Relationships (M)
Residential Internet (M)
Mobile Lines (M)
Residential Video (M)
Source: FY2025 Annual Report (Form 10-K), Item 1 Business — customer statistics [5].
Source: derived from Charter FY2016–FY2025 customer statistics, as reported in successive Form 10-Ks [6].
Mobile runs as a mobile virtual network operator on Verizon's cellular network, offloaded onto Charter's own WiFi where possible; a multi-year agreement to also use T-Mobile's network for Spectrum Business mobile is set to launch in 2026 [7]. In two sentences: Charter is a regional broadband utility that has converted a legacy cable-TV plant into an internet-and-mobile bundle, monetized through recurring monthly relationships. Its economics rise or fall on broadband, where subscribers have flattened and slipped while pricing has held.
The universe screen
Both universe gates pass, and neither is close. Charter's Class A common stock trades on the Nasdaq Global Select Market under CHTR — a US primary listing, not a foreign or Chinese ADR (U1). Market capitalization is $17.8 billion — the closing price of $129.22 on 22 July 2026 against 137.7 million shares outstanding — comfortably above the $10 billion floor (U2).
Market Cap ($B)
Share Price (22 Jul 2026)
Enterprise Value ($B)
Source: market cap derived from fit_features.market_cap — price of $129.22 (22 Jul 2026) × 137.7M shares; enterprise value adds FY2025 net debt of $94.3B from the consolidated balance sheet.
One caution the universe number hides: the $17.8 billion equity value sits on top of $94.3 billion of net debt, so enterprise value is roughly $112 billion — the equity is a thin, highly levered sliver of the business. The Yield and Self-Help tabs carry that arithmetic; here it is a fact about what the market cap does and does not represent.
Market structure — the raw material for durability
The durability question turns on whether year-10 revenue and cash flow can be higher with high conviction, and that is an argument about market structure. The evidence points to a capital-intensive regional oligopoly with real entry barriers — the profile of business Ruchir's system treats as survivable — with one live pressure worth stating plainly.
Competitive structure — a regional broadband oligopoly, not a monopoly. In wireline broadband, most of Charter's footprint is a duopoly at worst against a single telco. Charter faces terrestrial broadband competition (100 Mbps or faster) from AT&T fiber across roughly 27% of its footprint and from Verizon across roughly 16%; the balance sees only slower DSL, satellite, or fixed wireless [8]. Comcast, the largest US cable operator, is the closest structural peer but does not overlap Charter's territories — cable franchises are geographic. The newer and more consequential entrant is fixed wireless access: national mobile operators (T-Mobile, Verizon) now sell 5G home internet in Charter's markets, and this is the pressure that flattened broadband net adds after 2023 [9]. Video faces a wider field — direct-broadcast satellite, virtual MVPDs, and streaming services such as Netflix, YouTube TV and Disney+ — which is why that line is in managed decline [10].
Regulatory entry barriers. Charter's cable systems operate under nonexclusive local and state franchises that grant the right to run plant across public rights-of-way; federal law caps franchise fees at 5% of cable-service gross revenues and bars fees on internet revenue, and franchise renewals may not be unreasonably denied [11]. The franchises are nonexclusive — they do not legally bar a competitor — so the true barrier to entry is not the license but the capital.
Capital intensity is the moat. Overbuilding a last-mile broadband network is a multi-billion-dollar, multi-year commitment against an incumbent that has already sunk the cost. Charter spent $11.7 billion of capex in FY2025 — about 21% of revenue — and has spent $7.7 billion since 2022 on subsidized rural construction alone, activating roughly 1.3 million new passings [12]. This is the "capital-heavy essential" category — not the best business model, but the kind that survives because a garage startup cannot replicate the plant.
Source: derived from Charter FY2021–FY2025 consolidated statements of cash flows [13].
Essentiality and operating history. Broadband is a utility-grade product households treat as non-discretionary; Charter has operated the underlying cable business since 1993, roughly 33 years, and holds the second-largest US broadband base [14]. Structure is consolidating, not fragmenting: Charter's $34.5 billion merger with Cox Communications, the third-largest US cable operator, received FCC approval in February 2026 and is expected to close in mid-2026, creating the largest US cable-broadband operator with roughly 36 million broadband subscribers. Charter's related acquisition of Liberty Broadband — its largest shareholder, holding about 41.5 million Charter shares — is documented in the FY2025 filing [15].
The one fact that cuts the other way, stated plainly: residential broadband subscribers have declined for two consecutive years — from 28.5 million (2023) to 27.6 million (2025) — as fixed wireless takes low-end share. Revenue has nonetheless held flat near $54.8 billion on pricing and mobile growth, so this is not the high-single-digit, multi-year revenue decline that would disqualify the business outright; whether it is a temporary competitive squeeze or the start of structural erosion is the load-bearing question for Durability, which owns it.
First-pass exclusion screen
Auto-OEM (X1) — clean. Charter is a broadband and cable operator with no automotive manufacturing; the exclusion does not apply.
Consensus darling (X4) — decisively not. Charter is the inverse of a saturated, consensus-owned growth story. The equity is down roughly 84% from its 2021 peak close of $821 to $129 — a top-left-to-bottom-right chart, not the reverse.
Source: derived from daily closing prices, data/prices/daily.json; 2026 value is the 22 Jul 2026 close of $129.22.
Valuation confirms it. The stock trades at about 0.3× sales and roughly 5× EV/EBITDA — versus its own ten-year median near 10× — so the multiple has compressed by roughly half, the signature of fear rather than adoration. The sell side has not abandoned the name so much as feared it: the consensus rating is Hold, yet published price targets cluster well above the current quote (a mean in the $240–290 range against a ~$130 share), implying the disagreement is about timing and leverage, not solvency. On multiple-to-sales, coverage tone, and chart shape, this is a dislocation, not a darling — which supports rather than fails framework fit.
China dependence (S1) — absent. Charter is a wholly domestic operator: 58 million passings across 41 US states, 100% US-based employees [16], and revenue earned entirely within the United States [17]. China revenue and asset exposure is zero; the sensitivity flag does not apply.
One item surfaced here for the tabs that own it: Charter's share count has fallen from 296.7 million (FY2017) to 137.7 million (FY2025) — roughly halved over a decade of buybacks — the capital-allocation history the Self-Help tab evaluates against the levered-repurchase exception.
Dislocation
Charter's stock fell 70.6% from a $427.25 close on 16 May 2025 to a $125.54 trough on 22 June 2026, and sits at $129.22. This is a genuine dislocation, not drift: two earnings days did most of the damage — Q2 2025 (−18.5%) and Q1 2026 (−25.5%) — around a grind of broadband-subscriber-loss disappointments. Traded volume ran to 3.9x its pre-peak median. Forward cash-flow and earnings estimates fell in single digits while the equity lost seventy percent.
The drawdown, quantified
Peak — 16 May 2025
Trough — 22 Jun 2026
Current — 22 Jul 2026
Peak-to-Trough
Source: derived from the daily price feed; figures match fit_features.capitulation_gauge.drawdown exactly (peak $427.25, trough $125.54, depth −70.6%, 402 days peak-to-trough).
The fall took 402 days and moved in stages rather than one shock. From the 16 May 2025 peak the stock first drifted to $380 by 24 July — down 11% over ten weeks on ordinary volume, no dated event attached. It then dropped in two large earnings-day legs, with a persistent downward grind and one relief bounce in between, before capitulating into the June 2026 trough.
Source: month-end closes from the daily price feed, as reported. The 16 May 2025 intramonth peak ($427.25) and 22 June 2026 intramonth trough ($125.54) sit inside the May-2025 and June-2026 points respectively.
The trigger — two dated event legs
The framework distinguishes the event moment from preceding drift. Charter's slide has both, and separating them matters: the first 11% off the peak carried no identifiable catalyst and normal volume, so it is drift, not the moment. The two capitulation-scale days were both earnings releases.
Source: one-day moves and volume multiples derived from the daily price feed (median = 1.11M shares/day over the 180 days before the peak); event labels from the earnings-call transcripts and dated news releases [1].
Leg one — 25 July 2025 (−18.5%, 8.7x volume). On its Q2 2025 call Charter reported Internet customer losses of 117,000 — an improvement from 149,000 a year earlier — while second-quarter adjusted EBITDA grew just 0.5% [2]. Headline subscriber losses were not the shock; the market repriced on decelerating financials and a competitive environment management called unchanged. The stock fell from $380.00 to $309.75 in a session on volume 8.7 times the pre-peak median.
Leg two — 24 April 2026 (−25.5%, 11.9x volume), extended by −8.4% on 29 April. On the Q1 2026 call Charter reported the loss of 120,000 Internet customers, citing expanded fixed-wireless competition, higher mobile substitution, and ongoing fiber overlap [3]. Adjusted EBITDA declined 2.2% year-over-year, 1.8% excluding Cox transition costs [4]. This was the single largest day of the drawdown and, at $241.78 to $180.13, erased a quarter of the equity in one session.
The competitive mechanism behind both legs is stated plainly in the company's own risk disclosure: residential Internet "faces competition across our footprint from fiber-to-the-home ('FTTH'), fixed wireless broadband, Internet delivered via satellite and DSL services" [5]. The peak itself coincided with the 16 May 2025 announcement of Charter's $34.5 billion combination with Cox Communications [6] — the stock's high-water mark, from which it has fallen since. The two intervening quarters (Q3 2025, Q4 2025) produced no fresh capitulation: Q3 nudged up 1.3% and Q4 rose 7.6% as broadband losses came in smaller than feared. The damage concentrated in two earnings days.
The fear gauge
Vol Spike (20d avg vs median)
Peak Single Day (18 Jun 2026)
Leg 1 Day (25 Jul 2025)
Leg 2 Day (24 Apr 2026)
Source: 20-day-average multiple of 3.88x is fit_features.capitulation_gauge.volume_spike (max 20-day average volume in the peak-to-trough leg ÷ median daily volume over the 180 days before the peak); single-day multiples derived from the daily price feed against the same 1.11M-share median.
The measured volume spike is 3.88x on the profile's smoothed definition — the peak 20-day average traded volume within the fall against the pre-peak median. That is a real spike, though moderate on a 20-day basis. The emotion is clearer at the daily level: the two event legs printed 8.7x and 11.9x median volume, and the heaviest single day of the entire episode was 18 June 2026 at 16.1x median (17.9M shares), four sessions before the $125.54 trough. Peak traded volume landed at the bottom of the fall, not the start — the signature of forced, emotion-driven selling exhausting itself rather than orderly repricing. Consistent with that, the trough was followed within days by a ~9% bounce on a 26 June 2026 report of mobile-partnership talks with SpaceX [7].
Who was selling
The evidence on seller composition is thin, and the largest gap is structural: official reported short-interest data for CHTR was unavailable across every field in the run's short-interest feed (reported short interest, borrow pressure, and public net-short disclosures all returned zero rows), so short-interest level and change cannot be quantified here. This is a data gap, not a finding of low short interest.
What the corpus does support points the other way from informed selling. Charter itself was a persistent buyer through the fall: in Q1 2026 alone it repurchased 4.3 million shares for $963 million at an average price of $225 [8], roughly 74% above today's $129.22 — the company deploying cash into its own equity well above the current price. Two structural overhangs also sit on the register rather than active informed selling: the pending Cox combination, which will issue the equivalent of just over 46 million Charter shares to Cox Enterprises, and the Liberty Broadband transaction, which nets out to a smaller share reduction; together these move the as-converted share count to roughly 179 million at close [9]. Those are supply-and-structure facts, not evidence of holders who know something the tape does not. The volume-at-the-bottom pattern above is the clearest available read on who was selling: anchored holders capitulating into the trough.
Estimates versus price timing
The framework's signature is a price fall that outruns the estimate cut. Over the window where consensus revision history is available — the 180 days into 22 July 2026 — that is exactly the shape.
Source: consensus FY2027 normalized-EPS and revenue revision points from data/sp/estimates.json (momentum series, 180-day / 90-day / 30-day / current as-of dates); CHTR close on or before each as-of date from the daily price feed.
Between 23 January and 22 July 2026 the FY2027 EPS estimate moved from $47.4 to $44.5 — a 6% cut, essentially all of it after the 24 April earnings day — and the FY2027 revenue estimate slipped 3%, from $55.3 billion to $53.7 billion. Over the same span the stock fell 33%, from $191.69 to $129.22. The equity repriced roughly five times as hard as the near-term numbers. Extending the lens, consensus free-cash-flow estimates did not fall at all across the forward horizon: they rise from $4.9 billion (FY2026) to $6.2 billion (FY2027) to $7.3 billion (FY2028), derived from fit_features.consensus_forward_yield. Management's own framing on the Q1 2026 call put a 2028 free-cash-flow yield of over 25% against the current price on declining capex [10]. Consensus forward FCF yield on the current $17.8 billion market cap computes to 28% for FY2025 rising to 47% for FY2029 (fit_features.consensus_forward_yield). The sell side has not repriced the cash flows; the buy side has repriced the equity.
The one caveat on this section: the consensus revision history in the feed reaches back only 180 days, so the estimate path across the first, larger leg of the drawdown (May 2025 through January 2026) is not directly measured here. The direction is unambiguous for the measured window and consistent with the forward-FCF levels, which never fell.
Bottom line
There is a real dislocation. The stock is down 70.6% from its May 2025 peak, the fall is dated to two identifiable earnings-day event legs rather than a smooth slide, traded volume spiked and peaked at the bottom, and forward cash-flow and earnings estimates fell in single digits — or not at all — while the equity lost seventy percent. Whether that gap reflects temporary impairment or permanent damage to broadband economics is not settled here; that question belongs to the Damage Math trial. What this tab establishes is that the price moved far more than the near-term numbers did, on fear that concentrated into two dated events and one capitulation.
Damage Math
The equity fell 71% — roughly $44 billion — from its May 2025 peak. The enterprise fell 28%, and because net debt held near $94 billion, that entire enterprise decline landed on the equity. Yet the near-term numbers barely moved: FY2026 consensus EPS is up 15.6% and consensus free cash flow rises from $4.9 billion toward $8.4 billion by FY2029 as a finite capex bulge rolls off. Whether that gap is a mispricing or a deserved reset depends on the temporary-versus-permanent diagnosis, which the trial rules below at a 0.36 probability of temporary.
The near-term hit — a small numerator
The framework's setup is a short-term earnings cut the market extrapolates as permanent. Charter's numerator is unusually mild for a 71% drawdown. The top line is essentially flat, adjusted EBITDA actually rose 0.6% in FY2025, and income from operations slipped only 1.6% [1]. The variable that fell is free cash flow, and it fell for a self-imposed reason: capex.
Source: S&P Capital IQ consensus, data vintage 23 Jul 2026; see the CapIQ tab. Free-cash-flow path also carried in fit_features.consensus_forward_yield.
Two features of this table are the whole numerator. First, forward earnings are rising, not falling — normalized EPS climbs from FY2025's $36.36 actual to $41.96 in FY2026 (+15.6%) and to $45 by FY2028, driven by a falling share count and declining net debt on a flat top line. Second, consensus free cash flow nearly doubles, $4.9 billion to $8.4 billion, over four years. A permanent impairment of earning power does not leave the sell side modelling a doubling of cash flow.
The genuine deterioration is in the quarterly prints and the modest forward revisions, not the level. Normalized EPS missed in three of the last four quarters — Q2 2025 by 6.1%, Q3 2025 by 10.5%, Q1 2026 by 9.0% — while revenue stayed inside ±1% every quarter. Over the only window the consensus revision history reaches (the 180 days into 22 July 2026), the FY2027 EPS mark fell about 6% and FY2027 revenue about 3%.
Source: S&P Capital IQ momentum series, as-of dates 23 Jan 2026 (180d) through 22 Jul 2026 (now); money in USD.
Management gives no revenue or EPS guidance, so the guidance change that matters is capex: Charter now expects full-year 2026 capital expenditures of approximately $11.4 billion, excluding the pending Cox transaction — roughly flat with FY2025's $11.66 billion, and confirming the spending peak persists one more year before the decline [2].
Which line broke — and whether it self-corrects
Free cash flow fell from $8.60 billion in FY2021 to $3.16 billion in FY2024 and $4.42 billion in FY2025, while operating cash flow held near $16 billion throughout [3]. The entire swing is capex, which rose from $7.4 billion (FY2020) to $11.66 billion (FY2025) — a network-evolution upgrade to DOCSIS 4.0 plus subsidized rural line extensions.
Source: capex and FCF actuals FY2020–FY2025 from the Consolidated Statements of Cash Flows [4]; FY2026–FY2028 capex and company-defined FCF are Visible Alpha broker consensus (see the Models tab). Reported FY2025 FCF ($4.42B) sits ~$0.5B below the company-defined figure ($4.9B) used in the forward path.
The Visible Alpha driver set names precisely what is happening beneath the flat top line. Broadband subscribers erode every year — total internet subscribers fall from 29.66 million (FY2025) toward 28.18 million (FY2028E), net losses not narrowing — but residential internet ARPU rises through the period, so broadband revenue holds roughly flat: price defends the segment, not volume. Mobile is the only growth engine, adding ~1.3 million lines a year and lifting mobile revenue ~15% annually. Video and voice decline every year. The self-correction mechanism, if it exists, is arithmetic: capex falls from $11.4 billion toward ~$7.9 billion as line-extension spending (VA: $4.0B in FY2025 → $2.0B by FY2028) and the DOCSIS upgrade complete, converting directly into free cash flow while the share count keeps shrinking.
Source: Visible Alpha broker consensus via S&P Xpressfeed, 19 brokers, freshest revision 22 Jul 2026 (Models tab). Broadband subscriber and revenue trends corroborated in the FY2025 10-K competition disclosure [5].
The mechanism against self-correction sits in the same data: residential internet customers fell to 27.52 million in Q1 2026, down 1.6% year-over-year [6], while residential revenue fell 2.7%, internet revenue fell 1.3% despite rate increases, and video revenue fell 9.2% [7]. Charter itself discloses that residential internet now faces competition from fiber-to-the-home, fixed wireless, satellite and DSL across its footprint [8]. If the $11.4 billion is a structural maintenance level rather than a cycle, the cliff does not arrive and the depressed FCF is the true level. That is the trial's question, taken up below.
The price and EV change — a large denominator, amplified by leverage
Source: market cap = shares × close (peak 144.6M × $427.25; now 137.7M × $129.22, per fit_features.market_cap); net debt from the FY2024 and FY2025 balance sheets ($94.3B = $94.76B total debt − $0.48B cash) [9]. Enterprise value = market cap + net debt.
Placed side by side: consensus FY2027 EPS fell about 6% and revenue about 3% over the measured window, forward free cash flow did not fall at all — yet the market capitalization fell 71%. The equity lost roughly $44 billion. The enterprise value lost roughly $43 billion, a 28% move, because net debt was essentially unchanged across the window. That near-identity is the leverage mechanism: the entire $43 billion decline in the value of the whole business was absorbed by the equity, which entered the period as only 40% of enterprise value and now stands at 16%. A 28% mark-down of the enterprise translated into a 71% mark-down of the thin equity claim sitting on top of $94 billion of fixed debt.
Net debt to EBITDA is roughly 4.2x ($94.3B against $22.7B FY2025 adjusted EBITDA). At that leverage the equity behaves like a levered call on enterprise value — small moves in the whole-business valuation produce large moves in the equity, in both directions. This cuts against the buyer as hard as it cut the seller.
The NPV arithmetic — two scenarios, workings visible
The question is how much of the net present value of future cash flows the problem plausibly destroyed. The assumptions below are stated so the reader can reproduce or replace them.
Temporary treats the capex bulge as finite: free cash flow follows the consensus/Visible Alpha path — $4.9 billion (2026), $6.2 billion (2027), $7.5 billion (2028) — then a normalized $8.0 billion in perpetuity at 0% growth. Permanent treats today's depressed cash flow as the true level: $4.9 billion in perpetuity, declining 2% a year as competition grinds. Discounting each at 10%:
Source: two-stage discounted cash flow on the assumptions above; reproducible from the consensus path in the CapIQ/Visible Alpha tabs. Current price $129.22.
Both scenarios sit above the current price at a 10% discount rate — temporary at $547 per share (4.2x today), permanent at $296 (2.3x). To see what the market is actually discounting, invert the calculation. Holding free cash flow at $4.9 billion, the current $17.8 billion market cap implies a 27.5% cost of equity; holding the discount rate at 10%, it implies free cash flow declining about 17% a year, in perpetuity. Either is more severe than the permanent bear case itself describes — that case argues low-single-digit EBITDA erosion and free cash flow stuck near $4.5 billion, not a 17%-a-year melt.
Management makes the mirror-image version of this argument. On the Q1 2026 call, substituting expected 2028 capex into consensus 2026 free cash flow, Charter put its own stock at a free-cash-flow multiple of about 3.8x and a free-cash-flow yield of over 25% at the then-current price [10]. That framing is the temporary case stated by the issuer; the trial below weighs it against the evidence that the capex is structural.
The sensitivity below shows the equity value across discount rates. Even a punitive 15% cost of equity leaves the permanent scenario at $209 per share, above today's $129.
Source: two-stage DCF (temporary) and declining perpetuity (permanent, −2%/yr) at each discount rate; current price $129.22 for reference.
The gap. Measured against a normalized $8.0 billion, no-problem baseline worth ~$80 billion at 10%, the temporary reading destroys only the present value of a finite capex bulge — about $5 billion of net present value. The permanent reading destroys about $39 billion — the perpetual shortfall from $8.0 billion down to a declining $4.9 billion. Set those against the ~$44 billion the market actually removed from the equity:
- If temporary: price damage ~$44 billion versus plausible NPV damage ~$5 billion. The gap is roughly $39 billion — a large overshoot, the framework's signature.
- If permanent: price damage ~$44 billion versus plausible NPV damage ~$39 billion. The gap is largely absent — the price fell about as much as a permanently reset cash-flow stream is worth.
The arithmetic does not resolve itself; it hands the question to the diagnosis. The gap is real and large under the temporary reading and close to absent under the permanent one, and the two are separated by tens of billions of dollars. Which reading carries is the trial's to decide.
The trial — temporary or permanent, presented fairly
The temporary-versus-permanent question was argued by two opposing, corpus-cited briefs and ruled on by three independent judges reading in randomized order. Both cases at their strongest:
The case for temporary. Revenue is essentially flat (−0.6% in FY2025), so earning power is intact; the depressed variable is free cash flow, and it is depressed by a finite, self-imposed capex build — DOCSIS 4.0 plus subsidized rural line extensions — that management already guides lower. As the build rolls off, consensus itself models free cash flow nearly doubling to $8.4 billion by FY2029. Mobile adds ~2 million lines a year, a capital-light attach that lowers churn; the share count has fallen from 235 million to 138 million, retiring ~4% a year into a 28%-plus free-cash-flow yield. Full-pay retention held through the one-time ACP subsidy expiry.
The case for permanent. Residential internet customers fell from 28.54 million (FY2023) to 27.64 million (FY2025) and lost another 120,000 in Q1 2026 — losses that persisted well past the ACP shock (Q3 2025 −109k, Q4 2025 −119k, Q1 2026 −120k). Competition is now structural and converged: fixed wireless and fiber overlap much of the footprint, and Verizon says it is "taking broadband share." Pricing power is eroding even as rates rise — Q1 2026 internet revenue fell 1.3% despite step-ups. Video revenue fell from $17.6 billion (FY2021) to $13.7 billion (FY2025). The $11.4 billion capex bill to defend speed parity is itself evidence the moat now demands higher recurring investment.
Sources: ruchir/trial/case-temporary.md and ruchir/trial/case-permanent.md, each cited to the corpus. Underlying figures appear in the Models, CapIQ, and Durability tabs; competition disclosure at [11].
The ruling. The judges put the probability that the impairment is temporary at 0.36, with a mean across seats of 0.43 and a spread of 0.22 between the low and high reading — seats landed at 0.36, 0.36 and 0.58. The tally records this as not contested. The lean is therefore toward permanence: the weight of the evidence, as three blind readers scored it, is that the broadband and video erosion is a durable reset rather than a one-quarter anchoring error. Reading order moved the average only 0.11 (temporary-first 0.36, permanent-first 0.47), so the result is not an artifact of sequence.
Source: ruchir/trial/tally.json — ruling p_temporary 0.36, mean 0.433, spread 0.22 on the raw seat range, order-stability gap 0.11, contested = false.
One caveat the judges themselves flagged bears on the arithmetic above: the temporary case's keystone claim — that consensus free cash flow nearly doubles to $8.4 billion — cites a derived run feature and the data/sp/estimates.json feed rather than a corpus page, so it could not be verified with the page tool and was discounted in the scoring. The forward-FCF path is real vendor data, but it is a projection, not a filed fact, and the recovery it describes has not yet happened. The permanent case's evidence — customer losses, pricing erosion, the competition disclosure — is drawn from filed statements and management's own words. That evidentiary asymmetry is part of why the ruling leans as it does, and it is not the report's to override.
Bottom line
The price damage is unambiguous and large: the equity fell 71% and roughly $44 billion from its May 2025 peak, an amount nearly equal to the 28% ($43 billion) decline in the whole enterprise, because $94 billion of fixed net debt forced the entire enterprise mark-down onto a thin equity claim. The near-term fundamental hit is small by comparison — flat revenue, rising forward EPS, and a free-cash-flow trough driven by a capex bulge that consensus expects to reverse. Under a temporary reading the resulting gap is roughly $39 billion and the framework's setup is present in full; under a permanent reading the gap is largely absent and the price fell about as much as a reset cash-flow stream is worth. The trial places the probability of the temporary reading at 0.36 — its weight is on the reading where the gap is small. The mispricing the framework hunts exists only in the scenario the judges rated less likely, and the leverage that made the equity cheap makes it fragile in either direction.
Yield
On the framework's adjusted basis — reported free cash flow, less stock-based compensation, less the five-year average of acquisition spend — Charter generated about $3.7 billion in FY2025: a 21.0% yield on today's $17.8 billion market cap, and roughly four times its own 2019–2024 yield baseline. Against the levered class's 25% reference line, the current year sits about 400 bps short; management's committed capex roll-off and sell-side consensus both carry the adjusted yield above 25% within three years. Acquisitions are zero; SBC is the only adjustment that bites.
Sourcing note. The deterministic feature file returns adjusted FCF and its yields as not-computable, because stock-based compensation is absent from the structured cash-flow feed it reads. SBC is, however, reported plainly on every filed cash-flow statement. The table below is therefore reconstructed line-by-line from the 10-K cash-flow statements (FY2019–FY2025), with each SBC and FCF figure anchored to its filed page. Market cap, the consensus forward series, revenue, and share count are taken directly from the feature file, which computes them.
The adjustment, line by line
The framework's adjustment removes two things reported FCF flatters: the non-cash cost of paying employees in stock (SBC), and the smoothed cost of buying growth (five-year-average acquisitions). For Charter, only the first applies — the company has made no cash acquisitions since the 2016 Time Warner Cable and Bright House mergers, so every 10-K cash-flow statement from FY2019 on shows no acquisitions line in investing activities [1][2]. The five-year-average acquisition term is therefore zero, matching the feature file's implicit-zero treatment.
SBC is modest for a business this size — $315 million in FY2019 rising to $673 million in FY2025 [3][4] — so the adjustment shaves 1.2% to 1.5% of revenue off FCF, not the double-digit haircut that knocks serial issuers like Accenture out of the framework. Charter's share count is falling, not rising: the SBC dilution is more than offset by buybacks.
Adjusted FCF = reported FCF − SBC − 5-yr avg acquisitions; derived from company filings. Reported FCF = operating cash flow − capex, per the numeric feed (this is stricter than Charter's own FCF definition, which adds back the change in accrued capital expenditures — e.g. $5,004M vs $4,418M in FY2025). SBC and the absence of acquisitions anchor to the filed cash-flow statements: FY2023–25 [5], FY2021–22 [6], FY2019–20 [7].
Source: derived from the filed cash-flow statements [8][9]. The gap between the two bars is SBC alone.
The shape of the adjusted line is the whole story of this tab: adjusted FCF peaked near $8.2 billion in FY2021, fell to $2.5 billion by FY2024, and recovered to $3.7 billion in FY2025. That collapse-and-partial-recovery is capex, not the business — the section below on conversion shows why.
The yield, three ways
Current adjusted yield (FY2025 / today's mkt cap)
3-yr avg adjusted FCF / today's mkt cap
2019–2024 yield baseline (median)
Adjusted FCF ÷ market cap. Market cap $17.8B = $129.22 close (2026-07-22) × 137.74M Class A shares, per the feature file's market-cap derivation. Current = FY2025 adjusted FCF $3,745M; 3-yr avg = mean of FY2023–25 adjusted FCF ($2,960M); baseline = median of the FY2019–2024 year-end yields shown below.
Current adjusted FCF of $3,745M on a $17,799M market cap is a 21.0% yield. The three-year average of adjusted FCF ($2,960M) on today's market cap is 16.6%. Both are extreme numbers by any absolute standard — and both are the mechanical result of a 70% price collapse (covered in Dislocation) sitting on top of a temporarily depressed FCF denominator.
The baseline is where the fortress-versus-levered distinction shows up. Reconstructing the same adjusted-FCF yield at each fiscal year-end market cap, Charter's yield ran between 3.9% and 9.1% across FY2019–FY2024, with a median near 5.0%. Today's 21.0% is roughly four times that baseline — the feature file's jump test (current ≥ 2× a positive baseline) is met several times over.
Source: adjusted FCF (derived, above) ÷ year-end market cap (year-end close × year-end shares, from the price and share-count feeds); "Now" uses the 2026-07-22 close. A rising yield here is a falling price, not rising cash: adjusted FCF in FY2025 ($3.7B) is below its FY2020–21 level.
Unlike the framework's fortress signature — a stable ~3.5–4% name (Microsoft, Meta) jolted to 8–9% on a scare — Charter's baseline was never a clean, low fortress yield. It sat in the 4–9% band because the equity was always priced against a large, growing FCF stream carrying substantial leverage. The jump is real, but it is a levered name re-rating from a mid-single-digit equity yield to a 21% one, which is why the 25% reference line — not the 8–9% one — is the right ruler here.
One honest denominator caveat. The 21.0% divides total-company adjusted FCF by the Class A market cap only. Advance/Newhouse holds roughly a 10.9% common-equity interest through exchangeable Charter Holdings units that sit outside the 137.7M Class A count [10]. On a fully-exchanged basis (about 154.6M units, ~$20.0B), the same adjusted FCF yields roughly 18.7%. The framework and the feature file both use the Class A market cap, so 21.0% is the headline figure; 18.7% is the economically-consistent floor. Either way the name sits below its 25% bar today.
Which bar applies — the balance-sheet class
Charter is unambiguously in the levered class, so the 25% reference line governs. The computation, from the filed statements:
Source: FY2025 consolidated balance sheet — long-term debt $94,006M, current portion $750M, cash $477M [11]; operating income and D&A from the FY2025 statements of operations [12]. Net debt $94,279M matches the feature file.
Net debt of $94.3 billion against roughly $21.6 billion of EBITDA is 4.4× net debt / EBITDA (4.15× on Charter's own $22.7 billion Adjusted EBITDA basis [13]). Management reports the ratio at 4.54× on its last-twelve-months leverage definition and targets a range it is now moving down to 3.5–3.75× after the pending transactions [14]. Any of these clears the levered threshold (≥3.0×) with room to spare. The feature file leaves the class as "unknown" only because it lacked an EBITDA figure; the primary statements resolve it cleanly to levered.
State the position plainly: 21.0% on FY2025 adjusted FCF against the 25% levered bar — about 400 bps short on the current year; 16.6% on the three-year average — about 840 bps short. The name does not clear its bar today. Whether it does within Ruchir's window turns entirely on the capex normalization below.
Normalized mid-cycle yield — the capex roll-off
Charter's current-year FCF is depressed by a capital-spending peak, and normalizing for it is where judgment sits on top of arithmetic. The depression is not cyclical demand — it is two self-imposed, finite investment programs: the 1.2 GHz / DOCSIS 4.0 network evolution and the subsidized rural construction build ($7.7 billion spent since 2022) [15]. Capex rose from $7.6 billion in FY2021 to $11.7 billion in FY2025 while Adjusted EBITDA still grew — so FCF fell even as the business expanded.
Management states the timing directly: 2025 was the peak year of capital expenditure, and capital expenditures after this year will decline significantly; free cash flow will increase from an already significant amount, with capital intensity returning to 13–14% of revenue by 2028 and run-rate capex below $8 billion once the evolution and expansion programs conclude [16].
The normalization, with every assumption stated so a skeptic can recompute under an adjacent window:
- Operating cash flow: held flat at the FY2025 level of $16,077M. This is conservative — it assumes zero EBITDA growth and zero cash-tax relief over the normalization horizon.
- Normalized capex: $8,000M, the top of management's stated post-program run-rate (they say "below $8 billion"; using the ceiling is the conservative choice).
- SBC: held at ~$700M, roughly the FY2024–25 level.
- Acquisitions: zero, consistent with history.
Normalized adjusted FCF ≈ $16,077M − $8,000M − $700M ≈ $7,377M, a 41.4% yield on today's $17.8 billion market cap — the "~40% after the further fall" the framework associates with this exact name. Even a stressed alternate (operating cash flow falling to $14,500M, capex a higher $8,500M, SBC $700M) yields adjusted FCF of ~$5,300M, or 29.8% — still above the 25% bar. To fail the bar on normalized capex, one has to assume operating cash flow falls roughly 20% while capex stays near its peak — the opposite of what management has committed to and consensus models.
Source: analyst normalization on FY2025 operating cash flow [17] and management's stated post-program capex run-rate below $8B [18]. The 25% levered reference line sits between the stress case and the actual.
The reduction from $11.7 billion of capex in 2025 to below $8 billion by 2028 is, on management's own arithmetic, worth over $28 of free cash flow per share on today's share count [19] — against a $129 share price. This is also the framework's absurdity check: today's $17.8 billion market cap divided by normalized adjusted FCF of ~$7.4 billion retires the entire Class A float in roughly 2.4 years. A price making that claim is under strain.
The consensus check
CapIQ consensus does most of the work of confirming the normalization is not a private theory. The closest vendor proxy for adjusted FCF is consensus free cash flow (mean estimate), which tracks Charter's own levered-equity FCF definition — it does not subtract SBC, so it runs about $0.7 billion rich of the framework's adjusted basis. Naming that gap, the picture is:
Source: consensus FCF mean from the CapIQ estimates feed (data/sp/estimates.json), divided by today's $17.8B market cap; the feature file's consensus_forward_yield carries the gross column. Adjusted-equivalent column deducts ~$700M SBC from each year. Estimates are Charter standalone — management's guidance and the sell-side series exclude the pending Cox acquisition.
On the gross basis the sell side already has Charter clearing 25% every forward year — 27.6% in FY2026 rising to 47.4% by FY2029. On the SBC-adjusted basis, consensus clears the 10% moderate bar immediately, and clears the 25% levered bar by FY2027 (~30.7%), with FY2026 at ~23.7% just under it. The direction is unambiguous, and the mechanism is the same capex roll-off management has committed to — the sell side is not underwriting an operating turnaround, only the completion of a finite build.
So the framework's favorable reading applies: consensus forward FCF clears the bar, which means the setup is fear rather than a market that has concluded the fundamentals are broken. The 70% drawdown and the 3.9× volume spike (see Dislocation) are the fear; the cash-flow trajectory the sell side already models is the fundamentals.
The forward-path underwrite, stated as a probability with its path. The yield clears 25% on an adjusted basis within one-to-three years with roughly 75–80% probability, on this mechanism: capex falls from $11.7B toward a sub-$8B run-rate as network evolution and rural construction conclude by 2028 — a spending decision within management's control and already scheduled — while operating cash flow need only hold roughly flat. What consensus would have to concede for this to fail is an EBITDA decline large enough to eat the entire ~$3.7B capex tailwind. That is the real risk and it is not trivial: broadband subscribers are declining (119,000–120,000 net residential Internet losses per quarter recently) against fixed-wireless and fiber competition, and FY2025 was the first year of revenue decline. If EBITDA erodes faster than capex falls, the normalized yield compresses toward — or through — the 25% line. The 20–25% probability weight sits there. The two pending transactions (Cox, Liberty Broadband) further cloud the standalone forward math: at close the standalone share count rises to roughly 179 million on an as-exchanged basis [20], so per-share and per-market-cap figures will be redrawn even as Cox's cash flow is added — a point developed in Self-Help and Clock.
FCF-to-revenue conversion — the trend that tests the exception
The levered exception the framework grants Charter is conditional on FCF/revenue not deteriorating structurally. The record needs care, because two things move in opposite directions.
Source: adjusted FCF (derived) and revenue from the income statement feed; Adjusted EBITDA from the FY2025 and prior 10-K reconciliations [21]. Both expressed as a share of revenue.
The EBITDA margin is stable-to-rising — 39.9% in FY2021 to 41.5% in FY2025 — so the operating business is not decaying at the margin line. Adjusted FCF/revenue, by contrast, fell from ~15.8% (FY2021) to ~4.6% (FY2024) and recovered to 6.8% (FY2025). That decline is the capex peak passing through, not a margin problem — which is precisely what makes the normalization defensible rather than wishful. Had the EBITDA margin fallen alongside FCF conversion, the levered exception would not hold.
The genuine counter-fact the reader should carry: revenue itself has plateaued and turned down — $55.1 billion in FY2024 to $54.8 billion in FY2025, the first annual decline in the series, with the framework's own three-consecutive-year high-single-digit-decline disqualifier not yet triggered but the trajectory worth watching. Rising EBITDA margins on flat-to-declining revenue is cost discipline, not growth; the flywheel that a high adjusted yield is supposed to power (Self-Help) needs the revenue line to stop falling for the re-rating to be more than a capex-timing artifact. That tension — a plainly cheap adjusted and normalized yield against a top line that has stopped growing — is the honest shape of the yield case here.
Durability
Charter clears the mechanical disqualifier — no three-year high-single-digit revenue decline — and its reported free cash flow has never turned negative, with a smooth five-year rolling average. Two conviction sources hold firmly: the sunk-cost plant and the essentialness of broadband. But the year-10 gate carries a genuine doubt on the revenue leg: the broadband subscriber base peaked in 2023 and has fallen two years running against fixed-wireless and fiber entrants that are structurally adding capacity, and Internet revenue is now held up on price alone [1].
The conviction sources, graded for Charter
The year-10 gate draws conviction from five places. Charter holds two firmly, one partially and weakening, one with a caveat, and lacks one outright. Each is graded on this company's own evidence, not on an "infrastructure is forever" prior. The market-structure exposition is built in Business; this tab adds the durability grade and the movement in share over time.
Capital intensity as a moat — applies, strongly
The clearest source. Spectrum's network reaches 58 million homes across 41 states, a hybrid fiber-coaxial last-mile plant carrying gigabit speeds across the entire footprint and symmetrical multi-gigabit in part of it [2] [3]. Management puts the incremental cost of upgrading that plant to symmetrical multi-gig at just over $100 per passing — cheap because the plant already exists [4]. A new wireline rival, by contrast, must sink the whole cost first: Charter itself has spent $7.7 billion since 2022 to activate roughly 1.3 million rural passings [5]. This is the capital-heavy essential the framework means — a business that survives because the replacement cost of its footprint runs to tens of billions.
The qualification is the whole of the durability debate: capital intensity protects against a new wireline rival, not against a wireless one. Fixed wireless rides cell towers that already exist, sidestepping the last mile entirely. The moat is real against the threat it was built for and porous to the threat that is actually growing.
Essentialness — applies
Broadband is a genuine utility, and demand for it is rising rather than flat. Non-video Internet customers used roughly 825 gigabytes per month in early 2025, with over 30% of them above one terabyte, and usage compounds every year [6]. A household without connectivity cannot work, stream, or run its phones. What essentialness looks like in the data is churn: management describes it as "at or below historic lows," meaning customers leave over price and competitive offers, not because they stop needing the product [7].
Market structure — applies partially, and weakening
Broadband is a regional oligopoly, not a monopoly: most of the footprint is a wireline duopoly against a single telco (see Business). The durability complication is share stability, and here the record has turned. Charter's total Internet base rose through the pandemic to a peak of 30.59 million in 2023, then fell two consecutive years to 29.68 million — a loss of roughly 908,000 customers, 508,000 in 2024 and 403,000 in 2025 [8] [9].
Source: Charter FY2021, FY2023 and FY2025 Annual Reports (Form 10-K), customer statistics [10] [11] [12]. The FY2025 filing restates 2024 at 30,083.
The structure is no longer two players contesting a stable pool. A third pipe — fixed wireless from the national carriers — and a growing fourth — fiber overbuilders — now contest the footprint, and Charter faces terrestrial competition from AT&T fiber across roughly 27% of its footprint and Verizon across 16%, both higher than a year earlier [13]. The pace worsened into 2026: total Internet customers fell about 120,000 in the first quarter, versus roughly 59,000 a year earlier, with the Affordable Connectivity Program disruption now fully behind the base [14]. An oligopoly whose incumbent is losing units every year is a weaker conviction source than a stable duopoly, and it is graded that way.
Operating history — applies, with a caveat
Charter was founded in 1993, and the cable systems it runs are decades older [15]. The caveat is that today's Charter — its scale, brand, and levered-equity model — dates to the 2016 Time Warner Cable and Bright House combination, the point from which its buyback program runs [16]. The survival-through-cycles record of the current entity is closer to a decade than to the 30-to-50-year ideal, and it has not yet been tested through a full recession in its present, heavily levered form.
Regulatory entry barriers — does not apply
This is the source Charter lacks, and it matters because it is the one that shields the framework's banks and insurers. Charter states plainly that its cable franchises "are non-exclusive," so franchising authorities "can grant additional franchises to competitors in the same geographic area" [17]. A regulator does not stop T-Mobile or Verizon from selling home Internet, and the carriers already own the spectrum to do it. Federal and state policy is in fact pushing capital toward new broadband supply — Charter notes "billions of dollars in subsidies" for deployment through programs such as RDOF, ARPA, BEAD and the IIJA [18]. There is no regulatory gate keeping entrants out; if anything, the state is funding them in.
The structural threats, hunted
Execution is not a moat, so the question is not whether Charter operates well — it plainly does — but whether the structure of its market lets a well-capitalized attacker take year-10 revenue. A search of Charter's filings and of five peers' filings surfaces named, quantified threats. They are not waved at.
Fixed wireless access — the live one, and it is not execution
The national carriers are converting spare mobile-network capacity into home Internet aimed at cable's base. T-Mobile is now, on its own account, the fifth-largest Internet service provider in the country, with 12 million fixed-wireless customers [19]. Its stated strategy names the target directly: "We see our strength as attacking incumbents … a huge opportunity to attack incumbents across fiber and fixed wireless access" [20]. This is capacity added to Charter's markets by a company with a national spectrum position — a structural fact, not an operating stumble Charter can out-hustle.
Charter's read is more benign, and it is a genuinely two-sided point examined below: management says "cell phone Internet growth appears to have plateaued" and argues WiFi, not 5G, carries the household's traffic [21]. That call has been made repeatedly since 2023, and the unit losses have not yet stopped.
Fiber overbuild — a slower, permanent second front
Where fiber is built, cable's speed advantage narrows to nothing, and it does not retreat. AT&T ended 2025 with 32 million fiber passings and plans for 40 million by the end of 2026, then five million a year thereafter [22]. That is a decade of steadily expanding overlap with Charter's footprint, on top of the 27% AT&T already reaches. Charter's counter is that new fiber "builds are destined for poor financial returns," and that its own multi-gig upgrade is far cheaper than a fresh fiber build — also weighed below [23].
Video and voice — secular decline, already in the run-rate
The legacy products shrink structurally, not cyclically. In FY2025, video revenue fell 9.4% to $13,703 million and voice fell 6.0%; advertising fell 17.6% [24]. Streaming substitution is the named cause; Charter acknowledges it "negatively impact[s] the number of customers purchasing our video product" [25]. These lines are low-margin, so the revenue drag overstates the profit drag — but they are a persistent headwind on the top line, which is the leg of the gate under question.
Mobile growth rides on a rival's network
Charter's fastest-growing engine is structurally dependent on a competitor. Spectrum Mobile is an MVNO running over Verizon's network: the 22% mobile-revenue growth and 1.8 million net new lines are real, but the wholesale economics cap the margin and the arrangement is a supplier relationship, not owned infrastructure [26]. Verizon in early 2026 said it had "completed a comprehensive long-term agreement with Comcast and Charter to continue our partnership," which de-risks the dependency without removing it — the company Charter most relies on to grow mobile is the same one overbuilding its broadband [27].
Quantifying the year-10 impact
The threat is not abstract. Total Internet customers have fallen for two straight years, at roughly 400,000–500,000 per year against a 29.7 million base, and the pace roughly doubled year-over-year in early 2026 [28]. Held near that pace, the base would shed on the order of 12–15% by the mid-2030s — a meaningful bite out of the profit engine unless offset. The offset so far is price: FY2025 Internet revenue rose only because rate and mix added $785 million against a $380 million drag from fewer average customers, a net +$405 million [29]. Scale is being added on the other side — the pending Cox combination and the rural build expand passings (see Business) — but that is more customers to defend on the same contested terrain, not a structural barrier against the entrants.
The disqualifier check — revenue trajectory (X3)
The framework's one mechanical disqualifier is revenue declining high-single-digit for three consecutive fiscal years after a long existence. The feature file records the answer directly: revenue_trajectory.consecutive_decline_years = 1 and revenue_trajectory.three_year_hsd_decline = false. The disqualifier is not triggered.
Source: fit_features.revenue_trajectory; figures tie to Charter FY2025 Annual Report (Form 10-K), Revenues by service offering [30].
Revenue stepped up 43% in 2017 on the Time Warner Cable and Bright House merger, compounded at mid-single digits through 2022, then flattened: +1.1% (2023), +0.9% (2024), and −0.6% (2025), the first decline in the series and nowhere near the high-single-digit, three-year threshold. On the letter of the test, the structural-decline flag (X3) is checked and absent. The softer signal — a top line that has plateaued and just turned down, on a subscriber base already in a two-year decline — is not a disqualifier; it feeds the year-10 read below.
The year-10 case, both ways
The gate is binary by construction: year-10 revenue and year-10 adjusted free cash flow must be higher than today's, with very high conviction. Genuine doubt fails it.
The strongest case that both are higher
The revenue that is disappearing is the low-margin legacy; the revenue that is growing is the essential core. Connectivity — Internet plus mobile — was $27,527 million in FY2025, up 4.1%, and is 50.3% of total revenue [31].
Source: Charter FY2025 Annual Report (Form 10-K), Revenues by service offering [32].
Mobile grew 22% off low penetration with a long runway; data demand compounds; the multi-gig upgrade is cheap relative to a fiber rebuild; the Cox and rural expansions add passings; and management reads fixed wireless as plateauing and new fiber as return-dilutive [33]. On cash, the case is firmer. Capital spending peaks with the network-evolution and rural programs; Charter now expects to finish the network-evolution build in 2027 — a target that has already slipped from an earlier 2026 plan — and as that capex rolls off on stable-to-growing EBITDA, free cash flow inflects up [34] [35]. Consensus reflects the inflection — forward FCF estimates rise from about $4.99 billion (FY2025) to $8.43 billion (FY2029), well inside the ten-year window (fit_features.consensus_forward_yield). The FCF half of the gate is the more defensible half.
The strongest doubt
The doubt sits on revenue, and on the profit engine specifically. Internet revenue grew only because price outran volume — the FY2025 bridge is +$785 million rate and mix against −$380 million fewer customers [36]. Sustaining that requires pricing power, and pricing power against three balance-sheet-rich entrants that are structurally adding capacity — T-Mobile at 12 million fixed-wireless customers and climbing, AT&T heading to 40 million fiber passings and then five million a year — is precisely the out-execute-the-competition protection the framework says does not count on a ten-year horizon [37] [38]. The regulatory barrier that shields the framework's banks and insurers is absent; capital intensity guards the wireline flank but not the wireless one; video and voice keep shrinking; mobile's margin is capped by an MVNO dependency on a rival; and the top line has already turned down. Charter's broadband margin is exactly the opportunity three carriers are spending to capture — the Amazon test, applied here, cuts against durability.
The read
The FCF half of the gate is reasonably underwritten: as the capex peak passes, free cash flow should rise, and consensus already models it nearly doubling by 2029. The revenue half does not clear the "very high conviction" bar. There is a genuine doubt: whether year-10 revenue will be higher, given a broadband base that peaked in 2023 and is losing 400,000-plus customers a year to fixed-wireless and fiber entrants adding supply structurally, with the Internet line already sustained by price alone. The immediate counter-fact sits beside it — the connectivity core still grew 4.1% in FY2025 and mobile has a long penetration runway [39]. What would resolve the doubt toward the gate holding: broadband units stabilizing as fixed wireless saturates and the rural and Cox passings convert to net customers. What would confirm it: a third and fourth year of Internet-unit losses that ARPU can no longer offset, turning connectivity revenue negative.
FCF consistency (P2)
The consistency test is the rolling five-year average of adjusted free cash flow — volatile year to year is fine, unpredictable is not. A data limitation must be stated plainly first: the feature file returns fcf_stability.rolling_5y_avg as empty and not_computable, because stock-based compensation is missing from the cash-flow feed for every year 2016–2025, so the profile's adjusted-FCF series (adjusted_fcf.latest_adjusted = null) cannot be built. This is a feed gap, not evidence that Charter lacks SBC; it is recorded in the data gaps, and the adjusted-yield computation is owned by Yield.
What can be shown is the reported free-cash-flow series and its rolling five-year average, which speaks to the shape of the question even without the SBC and acquisition adjustments.
Source: reported FCF from fit_features.adjusted_fcf.series (company cash-flow statements); the 5-year rolling average is derived. Adjusted FCF (FCF − SBC − 5-yr avg acquisitions) is not_computable for this run — SBC absent from the feed.
Reported FCF swings widely — from $2.6 billion (2018) to $8.6 billion (2021) and back to $3.2 billion (2024) — but the swings track the capital-spending cycle and working capital, not underwriting losses. There are no negative years in the record, and the rolling five-year average is far smoother than the annual figures, holding in a $4.1–5.8 billion band across 2020–2025. That is the P2 signal: volatile but not unpredictable, and never loss-making. The negative-episode question the framework attaches to insurers and banks — a bad year every five to eight years as a healthy feature of the model — does not apply here; Charter's cash volatility is an investment-cycle phenomenon, not an underwriting-cycle one, with the 2020–2021 peak coinciding with a capex trough and the pandemic broadband surge and the subsequent dip reflecting the network-evolution and rural spend. The consistency pillar is met on the reported series, with the honest caveat that the adjusted series the framework prefers could not be computed.
What would change the durability read
The falsifiers are specific and datable. Toward the gate failing: a third and fourth consecutive year of Internet-unit losses that ARPU cannot offset, turning connectivity revenue negative; or fixed-wireless share continuing to compound rather than saturating. Toward the gate holding: broadband net adds returning to positive as fixed-wireless growth plateaus and the rural and Cox passings convert to customers; and free cash flow inflecting up as the capex peak rolls off. Leverage sits at 4.15 times EBITDA on roughly $94.6 billion of principal, a heavy load that the FCF inflection is meant to service and that Self-Help examines [40]. The revenue line is where the evidence must land; the cash line is the more secure half.
Self-Help
Charter carries $94.6 billion of debt principal at 4.15x adjusted EBITDA, but the maturity ladder is long-dated and the near-term wall is small against $4–5 billion of annual free cash flow plus a $4.4 billion undrawn revolver. It has executed roughly $71 billion of buybacks over ten years, cutting the share count 41%. The levered exception's three legs largely compute — a 28%+ forward yield, a demonstrated multi-year share reduction, and troughing-not-falling cash flow — with two live complications: a de-levering pivot and the share-issuing Cox deal.
The balance sheet against the problem's duration
Charter is a levered company by construction, not by accident. At year-end 2025 it reported $94.6 billion of debt principal and a leverage ratio of 4.15 times adjusted EBITDA [1], against $22.7 billion of adjusted EBITDA for the year [2]. Net debt is $94.3 billion. The deterministic feature file left the balance-sheet class as unknown because adjusted EBITDA was absent from its numeric feed; supplying the filed $22.7 billion figure resolves the class to levered (net-debt/EBITDA of 4.15x sits well above the 3.0x threshold), so the framework's ~25% levered yield bar is the one that applies here.
Debt Principal
Net Debt / Adj. EBITDA
Wtd Avg Cost of Debt
Liquidity (Revolver + Cash)
Sources: FY2025 10-K, Risk Factors [3] and Liquidity & Capital Resources [4]; weighted-average cost of debt per the Q1 2026 earnings call [5].
The question the framework asks is not whether the debt is large — it is — but whether its timing forces capital allocation toward paydown at the moment repurchases matter most. The maturity schedule answers that directly. From the debt footnote, the year-by-year principal and interest obligations are:
"9999" denotes "Thereafter." Source: FY2025 10-K, Note 9 — Long-Term Debt, contractual maturities of principal and interest [6].
Total principal is $94.6 billion and total contractual interest is $58.4 billion [7]. The near-term is undemanding: $1.1 billion matures in 2026, $3.6 billion in 2027, $5.4 billion in 2028 — $10.0 billion over three years against roughly $4.4 billion of annual free cash flow, $4.4 billion available under the credit facilities and $477 million of cash [8]. Two-thirds of the principal — $63.5 billion — sits in "Thereafter," beyond 2030 [9]. This is a laddered book, not a cliff.
Refinancing risk is muted by the interest-rate mix. Of the $94.6 billion, $82.7 billion is fixed-rate at a 5.07% average and only $11.9 billion is variable-rate at 5.36% [10]. With a 5.2% weighted-average cost of debt already in the book [11], rolling maturing paper at today's investment-grade-secured and high-yield cable rates is roughly cost-neutral rather than a squeeze; the debt is split between $55.4 billion of investment-grade senior secured notes and $27.3 billion of high-yield senior unsecured notes, giving access to both markets [12].
Covenants are not close to binding. The CCO Holdings indentures cap total leverage at 6.0 to 1.0; the actual ratio at that level was 4.0x at year-end 2025 [13]. Roughly two turns of headroom separate the company from the incurrence test. On the evidence, Charter can comfortably outlast a multi-year subscriber problem without capital allocation being forced to debt paydown — the near-term maturities are small, the rate exposure is largely fixed, and the covenant cushion is wide.
The repurchase record — executed, not authorized
This is a company that has actually spent the money. Across 2016–2025 Charter deployed roughly $71 billion of cash on share repurchases, and the count fell from 234.8 million shares to 137.7 million — a 41% reduction, and a 54% reduction measured from the 2017 post-merger peak of 296.7 million [14].
Source: cash actually spent on treasury-stock purchases, FY2025 10-K Consolidated Statements of Cash Flows (2023–2025 anchored) [15]; full 2016–2025 series derived from company filings (fit_features.share_count_trend.buyback_cash_per_year).
Source: diluted shares outstanding, derived from company filings (fit_features.share_count_trend); the 5-year share-count CAGR is −8.0%.
The record carries an uncomfortable footnote that the framework rewards a reader for noticing: much of this cash was spent expensively. The biggest years were 2020–2022, when Charter repurchased $11.2 billion, $15.4 billion and $10.3 billion at prices that ran to $600–700 a share. The four most recent quarters make the point cleanly — average execution prices were $365 (Q1 2025), $375 (Q2 2025), $259 (Q4 2025) and $225 (Q1 2026) [16] [17] [18] [19] — every one of them well above the $129 at which the stock now trades. The mechanism cuts both ways: the same $5.1 billion that retired about 15 million shares in 2025 would retire roughly 40 million — nearly 29% of the float — at today's price. The engine is real and running; the dislocation is what makes each turn of it far more powerful than the turns already taken.
There is no rising-share-count hard-fail on the executed record. Stock-based compensation is modest — $673 million in 2025, about 0.15% of the share count a year [20] — and dwarfed by a decade of retirement. The prospective complication is the pending Cox transaction, addressed below.
Management's buyback intent — from the record
Management's stated priority sequence has been consistent across the recent calls: reinvest first, then return capital, with debt sized to a target leverage band rather than paid down for its own sake. In Q1 2025 the CFO tied the two together — "appropriate balance sheet management and resulting share buybacks will drive stronger returns for shareholders" — and noted the company only resumed open-market repurchases in late February 2025 after shareholders approved the Liberty Broadband transaction, buying 2.1 million shares for $750 million [21]. By Q2 2025 the framing was blunt: "Our free cash flow is about to surge" [22].
The wrinkle a repurchase-focused reader must weigh is a genuine pivot in the leverage target. Historically Charter ran at 4.0–4.5x and issued debt as EBITDA grew to keep leverage in the band [23]. On the Q4 2025 call, management moved the post-transaction target down to "the low end of a new 3.5 to 3.75 times range," explicitly citing that it "heard our shareholders' preference for less leverage during a lower growth period," to be achieved within three years of the Cox close [24]. This is, on its face, the framework's own falsifier — capital allocation leaning toward lower leverage exactly when the buyback tailwind is maximal. Two facts temper it. First, management paired the pivot with a commitment that "even with this de-levering, we continue to expect significant ongoing capital returns to shareholders" [25]. Second, the de-lever is designed to come largely from EBITDA growth (including Cox synergies) rather than diverting free cash flow to gross paydown: the 10-K states that "as adjusted EBITDA grows, we expect to increase the total amount of our indebtedness to maintain leverage within Charter's target leverage range" [26]. Still, roughly half a turn of leverage reduction against a ~$24–25 billion combined EBITDA base absorbs cash that would otherwise buy stock; the pivot is a real claim on the flywheel, not a cosmetic one.
Insiders are buying alongside the company. During the drawdown, CEO Christopher Winfrey purchased Charter shares in the open market repeatedly — including at $172 in April 2026, $273 in July 2025 and $295 in February 2024 — and directors added to positions (Mauricio Ramos bought roughly $1.4 million at $141 in May 2026). His beneficial holding is about 1.0 million shares, and all executive officers and directors as a group hold 1,552,703 shares, or 1.10% of the company [27]. (Open-market purchase prices are from SEC Form 4 filings; no source PDF is published for those, so they are stated without a page link.)
The levered exception — does it compute
Charter is the archetype the levered path was written around, so the three legs deserve to be laid out with their numbers rather than asserted.
Leg 1 — FY26 Fwd Adj. FCF Yield
Leg 2 — 10-yr Share Reduction
Leg 3 — FY25 Free Cash Flow ($M)
Sources: forward FCF yield on current market cap (fit_features.consensus_forward_yield); share reduction 2016→2025 (fit_features.share_count_trend); FY2025 free cash flow, FY2025 10-K [28].
Leg 1 — massive yield. Consensus free-cash-flow estimates against today's $17.8 billion market cap imply yields of 28.0% (FY2025), 27.6% (FY2026), 34.6% (FY2027) and 41.1% (FY2028) — comfortably through the ~25% levered bar (fit_features.consensus_forward_yield). On a trailing basis, adjusted FCF of about $3.7 billion (see below) is a 21% yield, and Charter's own reported free cash flow of $5.0 billion a 28% yield; the trailing adjusted figure sits modestly under the bar while every forward and reported measure clears it. The precise adjusted-yield computation belongs to the Yield tab; this leg reads through.
Leg 2 — demonstrated multi-year share reduction. Clean: 234.8 million shares to 137.7 million, −41% over the decade (−54% from the 2017 peak), a −8.0% five-year CAGR, funded by ~$71 billion of executed repurchases [29].
Leg 3 — FCF and revenue not deteriorating. This is the leg that requires care. Revenue peaked at $55.1 billion in 2024 and slipped to $54.8 billion in 2025 — a −0.6% decline, its first, on a base that had been flat since 2023 (fit_features.revenue_trajectory; the three-year high-single-digit decline disqualifier is not triggered). Free cash flow troughed at $3.3 billion in 2023 and $3.2 billion in 2024 as network-evolution and rural capex peaked, and recovered to $4.4 billion in 2025 [30]; consensus has it climbing to $6.2 billion by 2027 and $8.4 billion by 2029 as capex falls from $11.7 billion toward under $8 billion (fit_features.consensus_forward_yield). So cash flow is troughing and recovering, not deteriorating — the leg holds on FCF. Revenue is flat-to-marginally-down with a shrinking subscriber base (broadband losses of 120,000 in Q1 2026), which is the honest weak point: two legs are met cleanly, and the third is met on cash flow but marginal on revenue direction.
The exception broadly computes — as the framework's own Charter precedent would predict. The two facts that keep it from being a clean pass are the de-levering pivot (a real, if partial, diversion of the flywheel) and the Cox transaction's share issuance (below).
The Cox complication
At the Cox close, Charter will issue the equivalent of just over 46 million Charter shares to Cox Enterprises, offset by a ~6.8 million-share reduction tied to the Liberty Broadband transaction; on an as-exchanged basis the standalone count would have been about 179 million shares had the deal closed on March 31 [31]. That is a ~30% step-up in the share count in a single event — the kind of increase the framework flags. The distinction that matters: this is one equity-funded acquisition that brings Cox's revenue, EBITDA and free cash flow with it (Charter also assumes ~$12.6 billion of Cox net debt and funds $4.0 billion of cash consideration with new borrowing) [32], not serial dilution or SBC creep. Management's claim is that the deal is free-cash-flow-per-share accretive; the framework's test is precisely whether the FCF acquired exceeds the equity issued, which the Damage Math and Yield tabs are better placed to adjudicate. For this tab, the plain statement is that the executed record is a genuine repurchase engine, while the pending Cox close interrupts the pure buyback path with a large, deliberate, one-time equity issuance.
The absurdity check
At $129.22 and a $17.8 billion market cap, the arithmetic of how many years of cash flow retire the entire float:
Sources: market cap $17.8B ÷ free cash flow. Adjusted FCF = FY2025 reported FCF $4,418M − stock-comp $673M − 5-yr-avg acquisitions ($0), derived from FY2025 10-K [33] [34]; consensus FCF from fit_features.consensus_forward_yield.
On trailing cash flow the whole equity is retired in roughly four to five years; on consensus forward cash flow — as capex rolls off — in about two-and-a-half to three. The company's own version of this arithmetic, offered on the Q1 2026 call, substitutes expected 2028 capex into consensus 2026 free cash flow and lands at "a free cash flow multiple of only about 3.8x, and a free cash flow yield of over 25%" [35]. A price at which the business can buy itself outright inside three years of forward cash flow is making a claim about permanent decline; the number is left to speak for itself. (The deterministic feature float_retirement_years is not_computable because adjusted FCF was absent from its feed; the values above are computed from the filed cash-flow components and consensus estimates, and the gap is recorded.)
Dividend safety
Charter pays no dividend; the return case rests entirely on repurchases and per-share cash-flow growth, so dividend coverage is not applicable here.
Management credibility
The record does not fit the promotional-CEO pattern the framework excludes — it reads closer to conservative-and-candid, with one honest operating miss. Testing the material promises of the last two-to-four years against outcomes:
- Capex discipline (kept/beat). 2024 capex was guided to $12.2–12.4 billion and came in at $11.3 billion; 2025 was guided to ~$12 billion, cut mid-year, and finished at $11.66 billion — undershooting guidance both years [36].
- Cash taxes (beat). 2025 cash taxes were guided to $1.6–2.0 billion and came in just under $0.9 billion after federal tax legislation — a favorable surprise, not a shortfall [37].
- The free-cash-flow-inflection timeline (slipped). In February 2024 management guided capex to "fall to approximately $8 billion by 2027" [38]; by the Q4 2025 and Q1 2026 calls the run-rate-below-$8-billion target had moved to 2028 [39]. The direction held and each year's spend beat its own guide, but the step-down that carries the whole return case has slipped roughly a year and been promised as imminent for several.
- Broadband growth (missed, then owned). In Q3 2025 management said flatly "we'll grow Internet customers again"; one quarter later it declined to project broadband growth at all, calling the path back "a game of inches." The reversal was acknowledged directly rather than spun — and on the same Q4 2025 call the CFO named the bear case aloud, saying the company must "overcome the perception of negative perpetuity growth implied in our valuation today" [40].
On ownership, insiders hold 1.10% as a group and the CEA is a repeated open-market buyer during the decline [41]; executive long-term incentive pay is heavily option-weighted, tying realized value to the share price. The stake is modest in percentage terms — the register is dominated by Liberty Broadband (29.07%) and Advance/Newhouse (13.21%) [42] — but the pattern is skin-in-the-game buying and candid disclosure, not big claims paired with quiet selling. This is a checked-and-clean record with one timing miss, not an exclusion.
Clock — what has to happen, and roughly when
Charter's re-rating runs on one dated mechanism, not a repricing cycle: a capital-spending peak that management says rolls off after 2025, lifting free cash flow while a shrinking share count does the rest. Consensus already embeds it — FCF from ~$4.9B (2026) to $8.4B (2029) on falling capex. But this drawdown (−71% from the May-2025 high, −85% from the 2021 peak) has no precedent in Charter's own history, and the base rates point to years of repair, not a quick round trip.
The re-rating mechanism
What closes the gap here is cost normalization rolling off, not an industry repricing round. Charter's capital budget is at its high-water mark. On the Q4 2025 call (reported January 30, 2026), management stated that 2025 was "our peak year of capital expenditure," that spending "after this year will decline significantly," and that capital intensity should return to 13–14% of revenue by 2028 [1]. After the network-evolution and rural-expansion programs conclude, run-rate capex "should be below $8 billion per year," a "meaningful downward trajectory" from here [2].
The arithmetic management itself put on the table: the capex step-down from $11.7 billion in 2025 to under $8 billion in 2028 is "equivalent to $28 of free cash flow per share based on today's share count" [3]. The 2026 budget is guided to approximately $11.4 billion — still elevated — with the decline landing in 2027 and beyond [4].
Sources: FY2025 capex actual and 2026 guidance per Q4 FY2025 earnings release [5]; 2027–2029 capex and free-cash-flow figures are consensus means from CapIQ estimates, as reported.
The mechanism has three moving parts, each with a rough window:
- Capex roll-off → FCF ramp (2027–2028). The first material step-down prints in 2027 (capex ~$9.5B vs. $11.4B in 2026), and the full effect lands by 2028 (<$8B). The FCF inflection is therefore a 2027-and-later event in printed numbers, not a 2026 one — 2026 FCF is still guided flat as capex holds near its peak.
- Denominator shrink (structural, but partly paused). Charter has retired roughly 41% of its shares since 2016 (234.8M → 137.7M by FY2025), and repurchased $760 million in Q4 2025 alone at ~$259 — well above today's price [6]. But the standing A/N repurchase mechanism was suspended in August 2025 and stays suspended through the Cox close [7], so the flywheel is throttled until the deal completes. The Self-Help tab carries the full buyback record.
- A feared event resolving: the Cox close (mid-2026). The $34.5 billion Cox Communications combination was announced May 16, 2025 — the same day Charter's stock topped at $427.25. Stockholders approved it July 14, 2025 [8]; the FCC cleared it February 27, 2026; and public reporting places the last remaining approval (the California PUC, with a vote scheduled for its August 13, 2026 meeting) ahead of a September 15, 2026 federal deadline, with the company targeting a mid-2026 close. The close is what restores the buyback mechanism and triggers the leverage reset described below — completion, not the announcement, is the catalyst.
On capital allocation, management reset its post-transaction target leverage to the low end of a new 3.5–3.75× range (from net debt/EBITDA of 4.54× at year-end 2025), to be reached within three years of the Cox close, while explicitly naming the market's view — "the perception of negative perpetuity growth implied in our valuation today" — as the thing it must disprove by winning in the marketplace [9]. That framing is the crux: the capex mechanism is largely mechanical, but the re-rating needs revenue and EBITDA to hold while capex falls.
Dated catalyst calendar
Sources: FCC and California PUC timing and the mid-2026 close target per regulatory filings and public reporting; Cox stockholder approval per company disclosure [10]; earnings-date windows from the reported-quarterly cadence in CapIQ/estimates data.
Base rates from Charter's own history
Charter's price has swung far more than its cash flow — the pattern Ruchir's system looks for. The question is whether the swing round-trips on his instruments' horizon. The full arc: an eight-year climb from ~$290 (2016) to an all-time high of $821 on September 2, 2021, then a three-leg decline — through 2022 to ~$303, a partial recovery to a lower high of $427 in May 2025, and a second collapse to $126 in June 2026.
Source: derived from the run's daily price series (2016–July 2026), as reported; 2026 shows the year-to-date high and the July 22 close of $129.22.
Set the current episode against the completed drawdowns in Charter's large-cap history:
Source: derived from the run's daily price series. Depth = trough close ÷ peak close − 1; days measured peak-date to trough-date.
Source: derived from the run's daily price series, 2016–July 2026.
The reading is unambiguous, and it cuts against a quick recovery. Charter's only two completed drawdowns of note — −35% in 2017–18 and −31% in the 2020 crash — both round-tripped inside roughly 4 to 22 months, but neither came close to the current depth. The −71% acute decline (and −85% measured from the 2021 all-time high) has no precedent in Charter's own record. The nearest analog, the −35% of 2017–18, was half as deep and still took about 22 months just to reclaim its prior peak. A fall twice as deep has never happened here, so the name's own history offers no base rate that supports an 18-month round trip; if anything, it implies the repair takes longer than the last, shallower one did. The full anatomy of who was selling sits in Dislocation.
The 18-month test
Weighing the mechanism against the base rates: the free-cash-flow inflection can plausibly print inside 18–24 months, but a full re-rating toward prior levels is a multi-year cycle-repair story, not a one-year snap-back. The evidence for the near-term half is dated and largely locked — 2026 capex guided to $11.4B and falling to under $8B by 2028 [11], consensus FCF rising ~70% to $8.4B by 2029, and the Cox close (mid-2026) restoring the buyback and resetting leverage. The evidence against a fast full recovery is equally concrete: this is a three-leg, multi-year structural derating, not a Centene-style single-year guidance cut; management itself concedes the market prices "negative perpetuity growth" [12]; consensus revenue estimates are still being trimmed (FY2027 revenue cut from ~$55.3B six months ago to ~$53.9B now); and the name has never round-tripped a drawdown a fraction this deep. This read is falsified if EBITDA or free cash flow starts sliding — the capex savings consumed by accelerating broadband and revenue erosion rather than dropping to FCF — or if capex fails to fall as guided, or the Cox close slips or breaks; that is the falsifier the Fit tab publishes with thresholds. The temporary-versus-permanent question the whole read hangs on is adjudicated in Damage Math.
What consensus expects, and when
The sell side is neither piled in nor fully capitulated — it is mostly on the sidelines. Of 21 covering analysts, none rate Charter a strong buy, 5 are positive, 11 hold, and 5 are negative (3 sell, 2 underperform); the consensus recommendation score sits at 2.9 on a 1-to-5 scale. The mean price target of $209.94 (median $190) implies roughly 47–62% upside from $129, but the dispersion is enormous — a low of $120, essentially at spot, against a high of $413.
Analysts (of 22)
Source: CapIQ street data (n = 17 targets; 22 recommendation entries incl. one no-opinion), as reported; spot $129.22 on July 22, 2026.
On when the recovery shows up in printed numbers: consensus does not expect it in 2026. It models revenue and EBITDA roughly flat (~$54B / ~$22B) through 2029, with the entire FCF gain coming from capex. The first fiscal year in which the inflection prints materially is FY2027 — FCF ~$6.2B versus ~$4.9B in 2026 — because that is when capex first steps down. The candidate quarter that would let the market re-underwrite it is therefore the Q4 2026 print (est. late January 2027), when Charter sets 2027 capex guidance and the FCF ramp becomes visible in the outlook; the nearer test is the imminent Q2 2026 print (est. late July 2026), the first since the June trough, where the market is watching whether broadband subscriber losses and EBITDA stabilize. The adjusted-yield math and the consensus rule are worked in Yield.
The instrument facts
Stated as facts, not as advice, and with no strikes, expiries, or structures suggested:
- Long-dated listed options exist. Charter carries actively listed options, and the chain extends to January 2028 expirations — 18 months beyond today — with 2027 LEAPS series also listed. Qualifying long-dated options (≥ 12 months, and here 18+) are available on the name.
- Liquidity / open interest. Options trade actively at a day-to-day level (recent single-session volume in the ~17,000-contract range), though open interest on individual far-dated LEAPS strikes runs in the low thousands of contracts — thinner the further out the chain you look.
- Implied volatility is elevated. Public options-market data puts Charter's 30-day implied volatility at approximately 70% as of July 22, 2026 (AlphaQuery, 30-day IV mean 0.698), consistent with a reading near 79% on June 29, 2026 (Market Rebellion), against a 52-week range of roughly 33–75. Against the framework's reference lines — up to ~50–55 acceptable, 60–70 elevated — this sits at the top of or above the elevated band. That is a stated fact about the current level; it is not a recommendation, and IV has not been estimated where a source was unavailable.
Instrument facts: long-dated listed options (through January 2028, 18+ months) exist on Charter; open interest on far LEAPS strikes is modest; 30-day implied volatility is approximately 70% as of July 22, 2026 (AlphaQuery), an elevated level against the framework's ~50–55 reference line. Facts only — no strikes, expiries, sizing, or structures are implied.